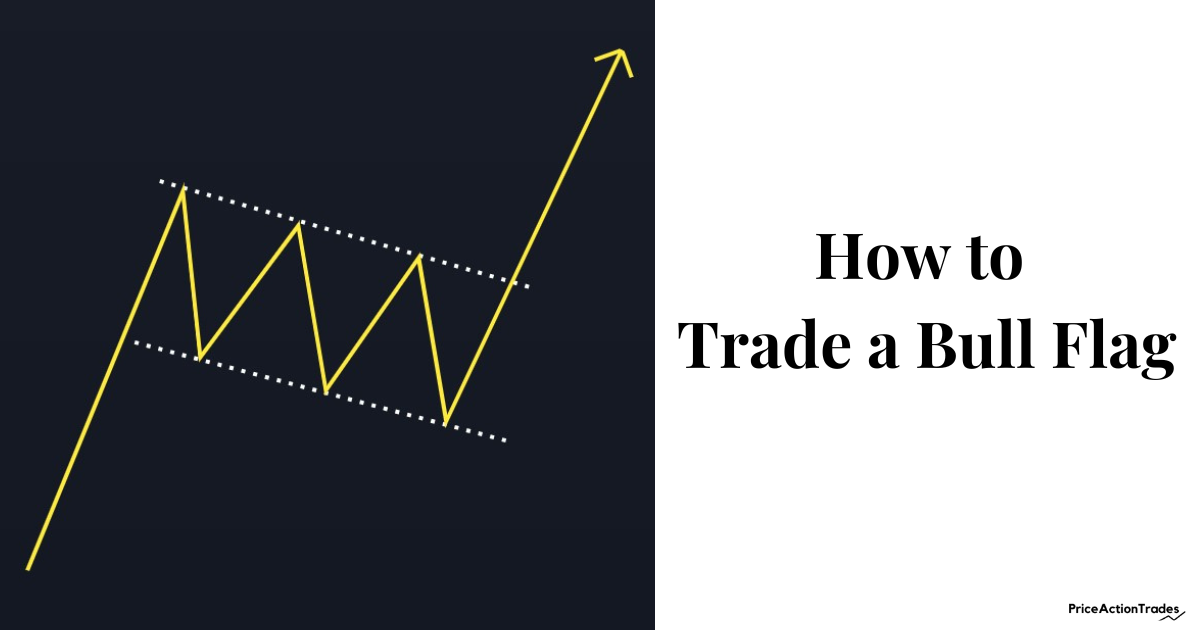
A Bull Flag is a bullish continuation pattern where the price consolidates in the opposite direction of the current market trend.
The price action gets relatively compact while the flag portion is being formed.
When you join the highs and lows of a Bull Flag you’ll often find the lines slant downwards with almost equal distance to each other (parallel).
This is the way the price consolidates in a bullish flag before it starts the next leg up.
However…
Irrespective of the name of the pattern the breakout can be both leg up or leg down.
A Bull Flag doesn’t give any guarantee that the price will keep continuing to the upside. But most of the time, it goes to the upside.
How to Trade a Bull Flag
Taking an entry in a Bull Flag is quite simple.
Just initiate a position at the time the price breaks out of either of the trend lines.
If it is breaking the upper trend line, you’ll take a long position (since the price is continuing to the upside).
And if it is breaking the lower trend line, you’ll initiate a short position (since the price is moving toward the downside).
Time Your Entry Using Multiple or Lower Time Frame Analysis
Before you take a position on a Bull Flag that is breaking out of range, you can analyze the chart on a lower time frame for added confirmation.
On the chart below of ADANI ENTERPRISES, I took a position by analyzing the Bull Flag on the 5 Minutes time frame followed by the 1 Hour chart.
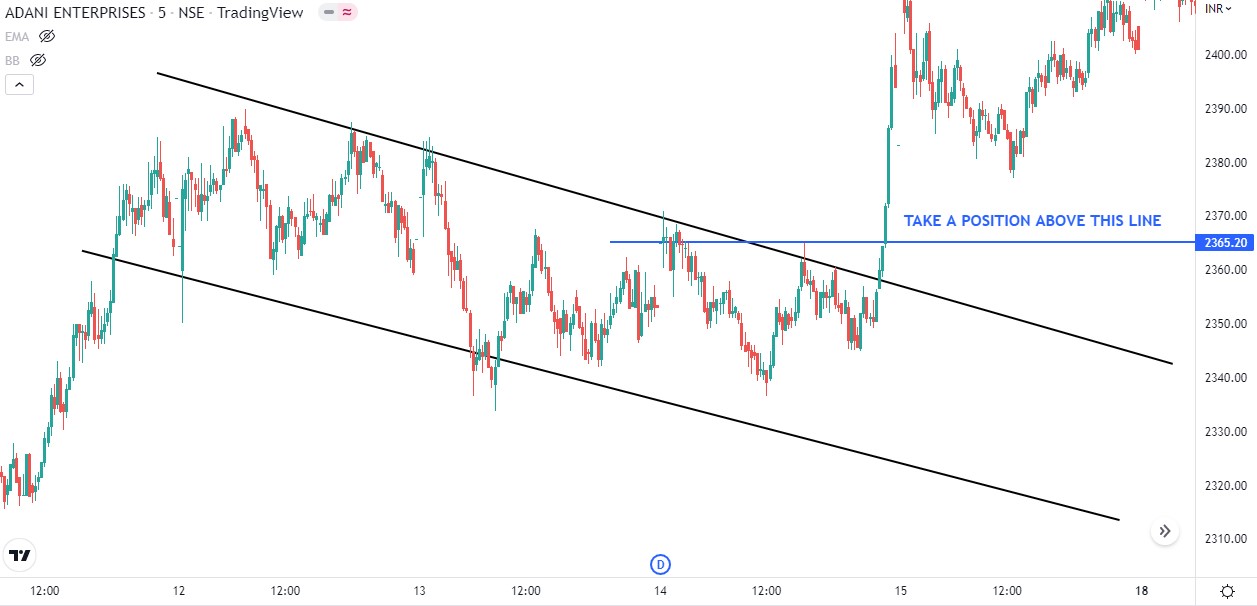
Although the flag has appeared on the 1 Hour time frame the 5 Minutes time frame analysis gives you more confidence to open a trade.

You can use other time frames such as 15 Minutes, 3 Minutes, or even 1 Minute to confirm your trade. There’s no perfect time frame to initiate a trade.
A Bull Flag Could Sometimes Be Rectangular
A Bull Flag doesn’t always appear as a congested price action zone that tilts downward. Sometimes you’ll find such zones as horizontal and if you connect the highs and lows you’ll spot a rectangular shaped Bull Flag.

This is IMPORTANT that you should keep in mind.
The method of trading is exactly the same, the only difference is the shape it takes.
Protecting Your Position or Setting Stop-Loss
Now right after you take a position the next thing you must need to do is to protect your position.
To protect your position you need to set Stop-Loss.
Lemme explain:
The best place to put your Stop-Loss in terms of a Bull Flag is just below the swing low of the pattern.
In the following image, the swing low of the pattern is marked with a blue line. You should consider putting your SL just below that line.

Alternatively, you can also put it below the breakout candle.
In the following image, the breakout candle is marked with a horizontal blue line. The SL will sit just below that line.

However, sometimes this approach may not work in your favor.
Because in some cases the price comes below the breakout candle (brutal retest) and then shoots back up again.
So the SL shouldn’t be too tight or too wide. The SL should always be logical. A too-wide SL will keep you remain in a losing position unnecessarily.
Now we’ve come to the next important part.
How to Measure the Price Target of a Bull Flag
The price target calculation of a Bull Flag is fairly simple.
Just measure the distance or height between the swing low of the pole and the swing high of the first candle which is being touched by the resistance line of the Bull Flag.

To find the target just place the vertical line or pole height at the diagonal support line of the Bull Flag perpendicular to the breakout candle, you’ll get the technical target.

But you know…
The price measuring technique could be a bit subjective from person to person.

From a subjective point of view, the swing low of the flag pole could be the low the price has started to rise from (#1 in a circular blue mark).
It could be the swing low that I’ve shown in the above example (#2 in a circular blue mark).
It could even be the swing low of the congested zone from which the flag pole has arisen (#3 in a circular blue mark).
One more thing worth mentioning…
What if the flag breaks out to the downside instead of the upside?
Nothing changes here.
The trading method remains exactly the same. The only difference is the way you set the target.
The target should be the swing low of the flag pole. It’s as simple as that.
In the following chart of the LTC/USD pair, the Bull Flag breaks out to the downside and perfectly meets the technical target.

Now you might be wondering…
Why this Bull Flag wasn’t able to push the price upward?
On the first attempt, the price got a huge rejection, and printed a Gravestone Doji.
On the second attempt, the price again got two rejections followed by a Bearish Engulfing candle.

And finally, the huge red candle (next to the Bearish Engulfing) broke the support line of the Bull Flag and started the downside price momentum.
How do you trade Bull Flags?
Frequently Asked Questions
A Bull Flag is bullish most of the time but not always.
Yes, a Bull Flag can also go down. However, a downside movement rarely occurs.
It is advisable to enter a Bull Flag only after the breakout.
As with any other chart pattern, Bull Flags are reliable to a certain extent. No chart pattern guarantees the next movement.
After a strong price rally, the buyers of a specific session get exhausted and a period comes where the market can’t decide where to move next.