A Pennant Chart Pattern generally allows you to make a quick and humongous profit.
The best thing is:
This pattern breaks out in the expected direction about 80% of the time.
(When it’s perfectly traded.)
And in this complete guide on Bull and Bear Pennants…
…I’m going to show everything you need to know to trade this pattern like a pro, step-by-step.
Let’s dive right in:
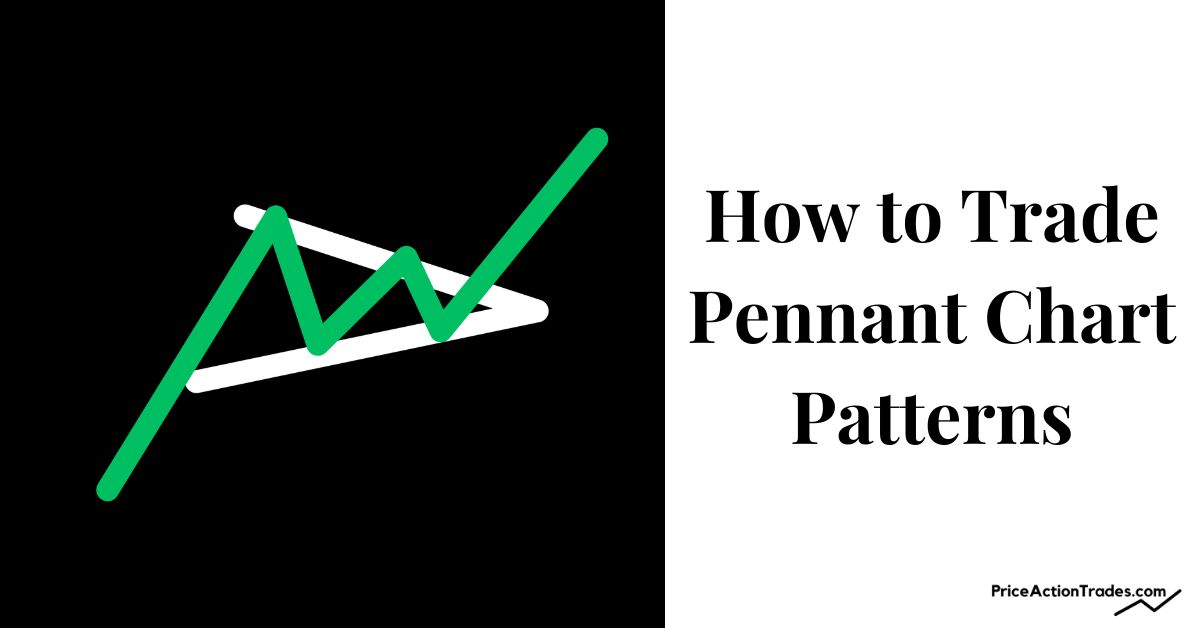
What is a Pennant Chart Pattern?
A Pennant is a trend continuation pattern, that generally appears in a strong uptrend or downtrend.

A Pennant is a consolidated price action in which the price takes a short breather before continuing its movement in the ongoing direction.
How to Identify a Pennant Chart Pattern?
To identify a Pennant you first need to understand its essential features.
Let me explain:
The pattern consists of a pole and two converging trendlines that form the Pennant.
The candles that create the Pennant gradually get smaller in price range and they create a series of Lower Highs and Higher Lows with decreasing volume.

Upon connecting the Highs and Lows of the candles using the trendline tool, the lines converge at a single point and form a small symmetrical triangle.
Now, let’s understand the pole formation.
Before the formation of the Pennant, the price generally moves rapidly almost in a straight line with High Volume.
This movement is called the Flagpole.
The Flagpole is the distance between the Last Swing Low and the Peak of the pattern.
The pattern height is measured by the length between the Last Trough (before the straight line rise) and the Peak or the Swing High of the Pennant.

The greater the pole height, the greater the strength of the Bulls in an Uptrend or the Bears in a Downtrend.
How to Trade Pennant Chart Patterns?
First, do let me tell you that:
I’ll explain the trading methods from a “Bull Pennant” perspective.
Because to trade Bear Pennants, you need to flip everything and do the opposite.
Moving on…
Method #1: Post Breakout
The moment the price breaks through the Upper Trendline of the Pennant and closes above it, open a Long Position.

If you are trading the Bull Pennant on a higher time frame like 1-Hour or 4-Hour…
…Then go to a lower time frame like 5-Minute or 15-Minute.
And let a candle close above the trendline before you initiate a long position.
See the following chart of AXS:

For the Stop-Loss…
Put it either below the Breakout Candle…

…Or just below the Swing Low of the Pennant.

What if it’s a Bear Pennant?
Just flip everything.
Let me explain:
Replace the Upper Trendline with the Down Trendline.
Open a short trade if a candle closes below it.

The smaller time frame methods will remain the same.
And the Stop-Loss?
Just do the opposite.
(Replace “Below” with “Above” and “Swing Low” with “Swing High”.)
Method #2: Pre Breakout
To enter into a trade before the breakout appears in the anticipated direction…
…Initiate a Long Position the moment the price touches the Lower Trendline of the Pennant.
A suitable scenario is:
Open a long position if the market prints a Bullish Hammer or an Engulfing Candle right after it touches the Lower Trendline near the apex of the pattern.

Now, you are probably thinking:
What about the Stop-Loss placement?
Well, there are three ways to do this…
The first one:
Put the Stop-Loss below the Last Swing Low.

The second one:
Put the Stop-Loss below the First Low of the Pennant.

The third one:
Close your position manually, if the price closes below the lower boundary of the Pennant.
SIDE NOTE: The Third Method should only be used by experienced and psychologically matured (in terms of trading) traders.
If the pattern is Bearish or a Bear Pennant…
Again, you need to do the opposite.
Method #3: On Pullback
A Pullback is when the price goes back to the Breakout Price Level before the continuation of the Strong Uptrend.
Now, to take an entry…
You can buy when the price touches the Upper Trendline of the Pennant.

And put the SL below the Pennant or the Last Swing Low of the Pennant.

Here’s another one:
Open a long position, when the price breaks out from the Pullback.
The Pullback Breakout can be detected by drawing a tight Down Trendline along the Highs of the Pullback Candles.

You can also do the following:
Draw a horizontal line (or two to make a Resistance Zone) along the common highs of the pullback.
And BUY when the price breaks out through the Resistance Line.

For the Stop-Loss:
Place it either below the Last Swing Low or the Absolute Low of the Pullback

And as always:
To trade Pullbacks following Bear Pennats, do the opposite.
Need an example?
See the following image:

How to Measure the Target of Pennants?
There are three ways to calculate the target of Bull and Bear Pennants.
#1: Traditional Full-Height Technique
Take the price difference between the starting point of the price rise and the highest peak of the pattern.
Now add the value to the breakout price of the Pennant.
Just like this:

If it’s a Bear Pennant…
Take the price difference between the starting point of the price decrease and the lowest valley of the pattern.
Now subtract the value from the breakout price of the Pennant.
Just like this:

#2: Pattern Height to the Pattern Low
Add the height of the pole to the Lowest Swing Low of the Pennant.
Just like this:

If it’s a Bear Pennant…
Add the height of the pole to the Highest Peak of the Pennant.
Just like this:

#3: The 50% Rule
This is a modified version of the first traditional technique.
See this:
If you find the pole height too long and in turn the target becomes too big…
…Then you can consider taking only 50% of the pole height.
This “50% Rule” increases the chances of reaching your price target dramatically.
Variations of Pennant Chart Patterns
A Pennant doesn’t always appear as a simple and horizontal triangle.
Sometimes it can be complex and cannot be so easily recognizable.
Based on visual appearance…
Pennants can be divided into 8 different types.
Variation #1: Horizontal or Classic Pennant

A Classic Pennant is the most typical of its kind.
The Pennant forms horizontally along with its pole.
It looks so perfect and hence easily recognizable and tradable.
Variation #2: Ascending Pennant

An Ascending Pennant looks like a Tiny Rising Wedge.
The Pennant consists of Higher Highs and Higher Lows.
The method of trading doesn’t change here.
Variation #3: Descending Pennant

A Descending Pennant looks like a Tiny Falling Wedge.
The Pennant consists of Lower Highs and Lower Lows.
The method of trading doesn’t change here.
Variation #4: Broadening Pennant

A Broadening Pennant looks like a Tiny Broadening Formation (that mostly appears in market tops and bottoms).
The Pennant resembles a Megaphone.
It consists of Higher Highs and Lower Lows and gradually broadens as the pattern develops.
The method of trading doesn’t change here.
Variant #5: Broadening and Ascending Pennant

A Broadening and Ascending Pennant (or Broadening and Rising) tilts upward and looks like an Ascending Broadening Wedge.
The pattern consists of Higher Highs and Higher Lows and gradually broadens by tilting toward the upside.
The method of trading doesn’t change here.
Variant #6: Broadening and Descending Pennant

A Broadening and Descending Pennat tilts downward and looks like a Descending Broadening Wedge.
The pattern consists of Lower Highs and Lower Lows and gradually broadens by tilting toward the downside.
The method of trading doesn’t change here.
Variant #7: Horizontal and Ascending Pennant

An Ascending Horizontal Pennant looks like a Tiny Ascending Triangle along with the pole.
The Pennant consists of Parallel (or Equal) Highs and Higher Lows.
The price gradually tightens and converges as the pattern develops.
As always…
The method of trading doesn’t change here.
Variant #8: Horizontal and Descending Pennant

A Descending Horizontal Pennant looks like a Small Descending Triangle.
(Read about Descending Triangle Here)
The pattern consists of Lower Highs and Parallel Lows.
And just like a Classic Pennant…
…The price gradually tightens and converges as the pattern develops.
The method of trading doesn’t change here as well (Did I state it too many times?).
PRECAUTION: Nearby Support or Resistance
Mostly, the price does a steep movement after it breaks out of the Pennant.
However, if there’s a significant “Overhead Resistance” or “Underfoot Support” close to the Pennant…
You should only take a trade if the target gives you a favorable “Risk-to-Reward Ratio (R/R Ratio)”.
If not, then stay away from trading such patterns.
The following example of a Bear Pennant illustrates an ideal situation:

SIDE NOTE: A significant Resistance or Support could be like, a previously congested zone, a price level where a Double Top or Bottom previously formed and the market did a Reversal from there.
Difference Between a Pennant and Symmetrical Triangle
Put simply, a Pennant is a small pattern and a short-lived consolidation.
Whereas a Symmetrical Triangle is a larger pattern with a longer zone of consolidation.

So, a Symmetrical Triangle takes more time to form.
Its price range will be pretty wide and it often gives trading opportunities inside the pattern before it does the breakout.
Quite similar to pennants, a breakout from a Symmetrical Triangle often occurs in the direction of the underlying trend.
But the method of trading a Symmetrical Triangle is different from that of a Pennant.
Conclusion
Pennants will give you trading opportunities in many different forms (Ascending, Descending, etc).
Following a Breakout, your goal is to ride with the increased momentum and mint profit from it.
The more you’ll trade and backtest them, the more you’ll be able to identify and trade them efficiently.
That’s all folks.
Any questions regarding Pennants?
Do let me know.
Do you know other tactics when it comes to trading Pennants?
Do let me know.