
An Inverse Head-and-Shoulders chart pattern (aka Head and Shoulders Bottom, Reverse Head and Shoulders) usually helps you to catch big upside movements.
Head and Shoulders Bottoms go to the upside as a successful breakout about 75% of the time.
In fact, it has the probability to give you impressive gains when you trade this pattern perfectly.
Fascinating, right?
So, in this in-depth guide on Inverted Head-and-Shoulders, I’m going to cover the following things to help you able to trade it in live market scenarios.
Let’s start with the basics.
What is an Inverse Head-and-Shoulders Pattern?
An Inverse Head-and-Shoulders is a bullish reversal chart pattern that typically appears at the end of a downtrend.
Following this, the price generally goes to the upside and starts a new uptrend.
The pattern consists of 3 uneven consecutive swing lows or troughs.
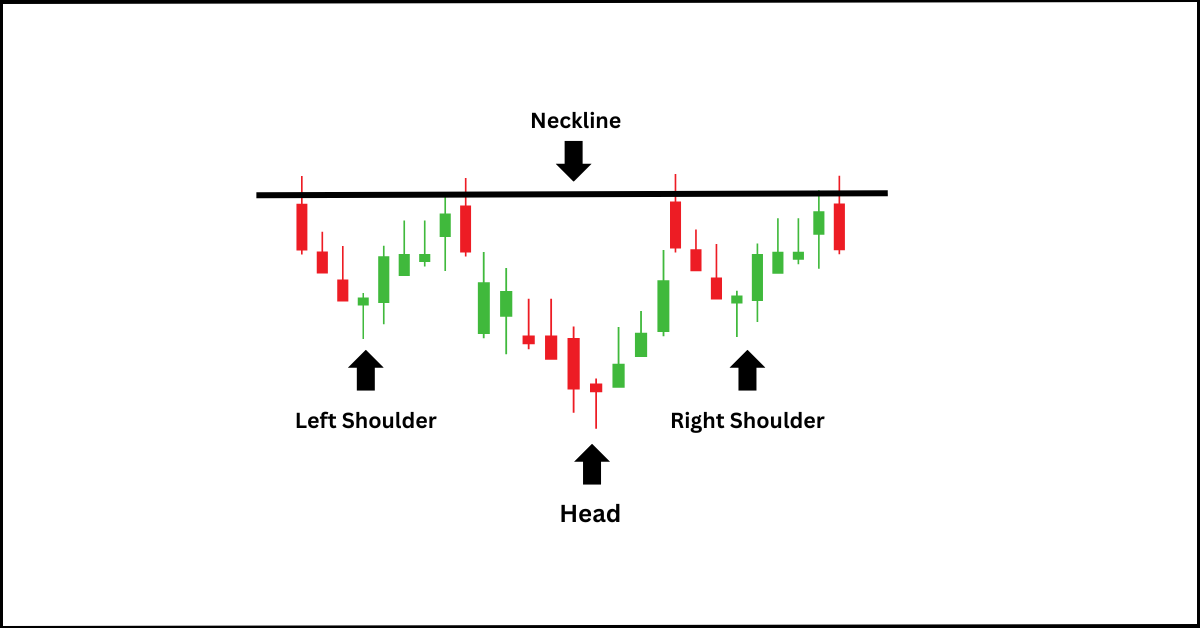
The longest trough in the middle is called the Head and is surrounded by two smaller troughs called the Shoulders.
The swing low on the right side is called the Right Shoulder.
And the left one is called the Left Shoulder.
The length of each adjacent shoulder is generally approximately equal in size.
The highs of a Head and Shoulders Bottom form a specific resistance level, which is defined by drawing a Trendline by connecting the consecutive highs of the pattern.
This Resistance Trendline is called the Neckline.
From a visual perspective…
This pattern resembles the upside-down bust of a person and hence it’s metaphorically called Inverse Head-and-Shoulders (just the opposite version of the topping pattern Head-and-Shoulders).
Moving on…
How to Indentify a Head and Shoulders Bottom?
To identify a Head and Shoulders Bottom you first need to understand the anatomy and mechanisms behind the formation of this pattern.
Let’s first start with its very first component The Left Shoulder.
The Left Shoulder of a Head and Shoulders Bottom is a part of successive swing lows of the current downtrend (dominating trend).
The shoulder on the left usually forms with high volume, the Head with relatively low (compared to the left one), and the Right Shoulder forms with even lower volume.
NOTE: The volume remains the highest (more than the shoulder at the left) from the start of the downtrend before the formation of the Left Shoulder. However, don’t give too much weightage to the Volume Pattern, because it may not always develop in such a particular way.
The Right Shoulder is where the market forms a Higher Low, which indicates a possible trend change as well as a deceleration of the current downtrend.
The background force behind the formation of the pattern is this:
The sellers take the price to a new low then buyers come and take the price a bit higher.
The Left Shoulder formed.
However, the price encounters resistance at a certain level, and then the sellers take the price even lower than before.
This time the sellers are unable to push the price to continue going lower.
At this location, the buyers come to accumulate even more and thrust the price higher (with the anticipation of “price is low enough to start a new uptrend).
Now, the Head portion formed.
During the upthrust, the price faces selling pressure again at the previous resistance zone.
The bears try to push the price again but lose control sooner than before.
Thereafter, the bulls come and push the price higher again.
The Right Shoulder formed.
If the buyers are strong enough, they’ll change the direction of the trend and will take the price much higher above the Neckline.
The next thing?
Well, the next thing is to learn the strategies of trading an Inverted Head and Shoulders pattern.
How to Trade an Inverse Head and Shoulders Pattern?
You can trade an Inverse Head and Shoulders pattern in 3 different ways.
Method #1: After the Breakout
To put it simply, this is where you open a long trade right after the price breaks out through the Neckline to the upside.
The question is:
How would you make a perfect entry?
I’ll explain:
The best way to time your entry (a perfect entry) is to use a smaller time frame, like 5-Minute.
The moment the price approaches the neckline (resistance), switch to the 5-Minute chart and wait for a candle to close above the neckline.
If it does, then initiate a long position on the next candle open.
Take a look at the following chart of TESLA stock:
There’s an Inverse Head and Shoulders on the 1-Hour time frame.

Now switch to the 5-Minute time frame.
If a candle close above the Neckline then the stock can be bought immediately on the next candle open.
Just like this:

But here’s a caveat:
If the candle that has closed above the neckline is a Pinbar or a Doji, you should avoid opening a long position on the next candle open.
Instead, you should wait and see if a candle has closed above the high of such an unconfirmed candle (like Doji or Pinbar).
Want an example?
See the following chart of NVIDIA Corp:

The stock did a nice breakout from the Reverse Head and Shoulders on the 1-Hour chart.
However…
The price did a few tease breaks before the actual breakout on the 5-Minute chart.

The few pin bars on the chart above the neckline indicate a weak breakout.
So, what’s the rule of thumb?
Wait for a candle to close above the high of the pin bar.
This will give you a stronger and better breakout signal.
The other thing is the VOLUME.
If the breakout is occurring with relatively low volume then you should proceed with caution.
You may watch for a few more candles to print to see if the volume is gradually increasing.
To make it simple…
Just wait for a 1-Hour candle to close above the Neckline of the Reverse H&S Pattern.
Now, you may be wondering:
Where would I place the Stop-Loss?
Well, there are 5 ways to do this.
The first one:
Put your Stop-Loss just below the breakout candle (An aggressive approach).

The second one:
Put your Stop-Loss just below the Right Shoulder (A bit conservative approach).

The third one:
Put it below the 50-Period SMA (Simple Moving Average).

The fourth one:
Put it below the last low (last trough) on the 5-Minute chart.

The Fifth and the last one:
Place your Stop-Loss below the congested zone on the 5-Minute chart if the price was consolidating in a tight range (buildup) before the Breakout.
The advantage of using this “After the Breakout” method is that you get more confirmation for going long.
NOTE: The Inverse Head and Shoulders pattern completes only after the price breaches the Neckline. Until the upside breakout, the pattern is unpredictable and difficult to trade in any direction. This is why most traders trade this pattern (in fact any) only after the breakout.
And the disadvantage?
The disadvantage is that you may get nervous if the market does a pullback.
The solution?
Take partial profit after the price pumps a bit in your favor.
Method #2: On Pullback or Retest
A pullback is when the price goes back to the breakout zone.

This is a normal and healthy phenomenon that can often be seen in the financial markets.
Now, you might be wondering…
Do pullbacks always occur after the breakout?
No, they don’t.
However, pullbacks occur about 56% of the time.
The question is:
How should you trade pullbacks?
See this:
The moment the price enters the previous resistance zone (resistance area near the neckline) and that area acts as a potential support zone, you can initiate a buy position there.

The condition is:
There should be at least two candle closes in that area and not below it.
In the chart above…
The AMD stock did a pullback, created two troughs, and then continued its upside movement.
You can go long on a specific candle open near the pullback support zone.

If you are a conservative trader who needs more confirmation and wants to be on the safer side…
…Then you can open a position if the pullback breaks out from its range to the upside.
Just like this:

But here’s a caution:
You need to pay attention to the volume.
The pullback should happen with low volume.
In the following chart of AMD, the pullback happened with a relatively low and decreasing volume.

If it happens with high or increasing volume, then it will be a sign of weakness.
When you see something like this, it would be better not to trade such patterns.
However, if the pullback turns into a breakout, you can definitely go to open a long trade.
And see, if the price goes in your favor or not.
But what about the Stop-Loss?
The principle of Stop-Loss placement doesn’t change here.
Put it either below the breakout candle, or just below the support zone of the Neckline.
You can also place it below the 50-Period SMA (or simply 50 MA) which I previously mentioned.
Method #3: Before the Breakout
If you are an aggressive trader with a high-risk appetite then you can open a long position at the potential Right Shoulder.
However, there’s a procedure.
I’ll explain:
Draw a Micro Down Trendline (Bear Trendline) by connecting the highs of the candles going downward.

The moment the price closes outside of the Bear Trendline, initiate a long position on the next candle open.
The drawback of this strategy?
Well, the price may not keep going to the upside after the Down Trendline breakout.
Since this approach is anticipatory in nature, it has a probability that the price would break the low of the Right Shoulder as well as the Head.
This may result in a continuation of the current downtrend.
So, how would you protect yourself against such disasters?
It’s pretty simple…
See this:
Place your Stop-Loss just below the low of the Right Shoulder.
If you want complete invalidation and a wider SL…
Place it below the low of the Head.
But make sure that putting your SL below the head often results in a horrible Risk-to-Reward Ratio.
Moving on…
How to Measure the Target of an Inverse Head and Shoulders Pattern
To measure the target of an Inverse Head and Head and Shoulders, you first need to calculate the height of the pattern.
The calculation is simple.
Let me explain:
Select the “Trendline Tool”.
Click on the bottom of the Head, drag it vertically to the Neckline, and click there.
Now put the vertical line at the location of the breakout price.
The breakout price location is where the candlestick breaks through the Neckline for the first time.
Just like the following:

Voila!
You got the technical target of the Head and Shoulders Bottom.
To calculate the price target manually (without the help of the Trendline Tool)…
Follow the steps below:
Take the price difference between the low of the Head and the Neckline (height of the head).
Upon successful calculation of the difference in price, subtract that number from the Breakout Price Level of the Neckline.
For example:
If the low of the Head is 10 and the price level of the Neckline perpendicularly from the low of the Head is 15, then subtract 10 from 12 and you’ll get 5.
Now, find the price at which the candlestick breaks through the Neckline.
In the example above it is 14.
So the target will be calculated by adding 5 to 14 and you’ll get 21 (14+5=21).
Even better:
Just use the following equation to ease the process.
Target = Height of the Head + Breakout Price
So, whenever a Reverse H&S appears, just fill in the variables and you’ll be good to go.
Location of Inverse Head and Shoulders
The location where an Inverse Head and Shoulders appears also plays an important role.
Because the location of its formation could affect its post-breakout performance.
I know what you’re thinking:
What are those locations (and scenarios) where an Inverse Head and Shoulders can possibly appear?
Let me explain:
1. Market Bottom

A Reverse H&S performs best when it appears at the absolute bottom of a prolonged downtrend.
This is where a Head and Shoulders Bottom forms a potential accumulation zone, following which the price often changes its direction and starts to increase at an exponential rate as a reversal pattern.
2. Uptrend Continuation

In a strong uptrend, an Inverse Head and Shoulders may appear as a continuation pattern.
This formation may develop in an uptrend when the price takes a breather (or pause) before the continuation of the prevailing trend.
The post-breakout performance of a continuation Inverse H&S may not be as impressive as it does from a bottom reversal pattern.
Whatever the post-performance may be, if it does an upside breakout in an uptrend it gives a long opportunity.
3. Downtrend Continuation

A Reverse Head and Shoulders can appear in an ongoing downtrend.
This is where some traders get excited and they go long on the breakout to eventually lose money afterward.
You may be wondering:
How this could lead to failed long trades?
The reason is that the market may not have reached the bottom yet.
So, what is the best way to confirm that?
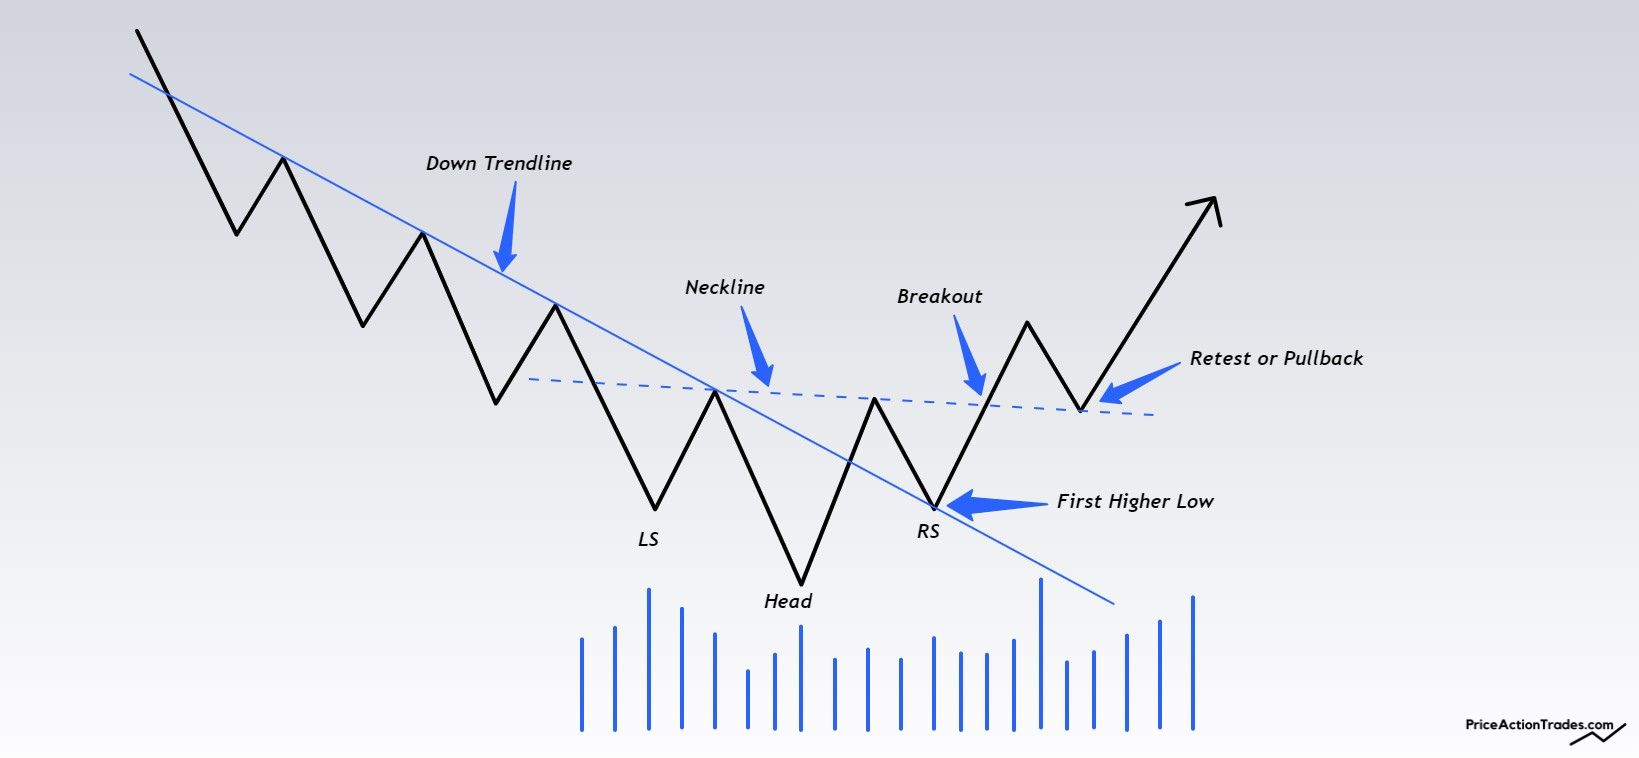
Draw a Down Trendline by connecting the lower highs and see whether the Inverse Head and Shoulders is forming inside or outside of the Trendline.
If the pattern is below the Download Trendline…
Then the Reverse H&S is probably forming as a consolidation before the market continues the prevailing downtrend.

Now, the question is:
What is the ideal way of trading a Downtrend Continuation Inverse H&S?
See this:
Open a short selling position right after the price breaks out of the low of the Head.
If you want to initiate a hostile entry then open a short position when the price breaks below the Micro Up-Trendline and closes below it.
It is a trendline that can be drawn from the low of the Head followed by connecting the subsequent higher lows.
Just like this:

But do keep in mind that the latter technique is done without confirmation, which might affect your win rate down the road.
4. Inverse Head and Shoulders in Ranges
If an Inverse Head and Shoulders forms in a range, there’s a very high probability that the pattern won’t work as per your expectation.
Do you know why?
Because the resistance of the range hinders the upside potentiality of Head and Shoulders Bottoms.
The following hypothetical line chart demonstrates how this pattern may appear in a real market situation.

As you can see, the resistance of the range is very close to the Neckline, which often prevents the price to climb further to the upside.
But an Inverse Head and Shoulders may become tradable even in ranges.
Do you know how?
See this:
If somehow the pattern forms at the end of a trading range and also the resistance of the range is far away…
…it becomes tradable.
Just like this:

The reason is:
The technical target (Measured Move) of the pattern can easily be achieved since there’s a lot of room for the price to grow from the breakout level of the Neckline.
How do you trade Inverse Head-and-Shoulders? Do let us know in the comment section below.
Key Takeaways (TL;DR)
- The Inverse Head-and-Shoulders is a bullish reversal chart pattern. Upon breakout, the primary trend often changes from Bearish to Bullish.
- An Inverse Head-and-Shoulders consists of 3 troughs with the middle one being the longest.
- The Right Shoulder of a Head-and-Shoulders Bottom is nothing but a higher low which indicates a potential trend shift from bearish to bullish.
- The line that connects the highs of an Inverse Head-and-Shoulders is called a Neckline.
- An Inverse Head-and-Shoulders pattern completes when the price breaks out from the Neckline.
- A Reverse Head-and-Shoulders becomes more reliable when you trade it after the breakout.
- Trading Head-and-Shoulders Bottom on the Pullback increases your chances of winning but you won’t be able to initiate a trade when the Pullback doesn’t occur.
- Use smaller time frames to make early or sniper entries.
- The target of an Inverse Head-and-Shoulders is calculated by adding the height of the pattern to the breakout price.
- The best Stop-Loss placements for an Inverse Head-and-Shoulders are: Below the Right Shoulder, below the breakout candle, below the 50-Period Simple Moving Average (SMA), etc.
- An Inverse Head-and-Shoulders can sometimes act as a continuation pattern in both uptrend and downtrend.
- A Head-and-Shoulders Bottom doesn’t usually perform well in a range-bound market.