
A Symmetrical Triangle (aka Coiling, Contracting Triangle) is one of the most common chart patterns among many others.
This triangular-shaped pattern usually helps you to spot potential price breakouts to ride the next trend wave.
So in this article, I am going to show you the step-by-step process…
To quickly identify and trade the pattern.
And also to find ENTRY and EXIT points like a pro for maximum gains.
Let’s dive right in.
What is a Symmetrical Triangle?
A Symmetrical Triangle is a neutral chart pattern that appears in both uptrends and downtrends.
Although this pattern is generally considered neutral, it often acts as a Continuation Pattern of the underlying trend (when it appears midway) as well as a Reversal Pattern when it appears at the end of a downtrend.
A Symmetrical Triangle consists of Lower Highs and Higher Lows.
The pattern appears wide at the beginning and gradually turns narrower as the pattern develops on the way to its climax.
How to Identify a Symmetrical Triangle?
A Symmetrical Triangle is first identified by connecting the subsequent Highs and Lows using trendlines.
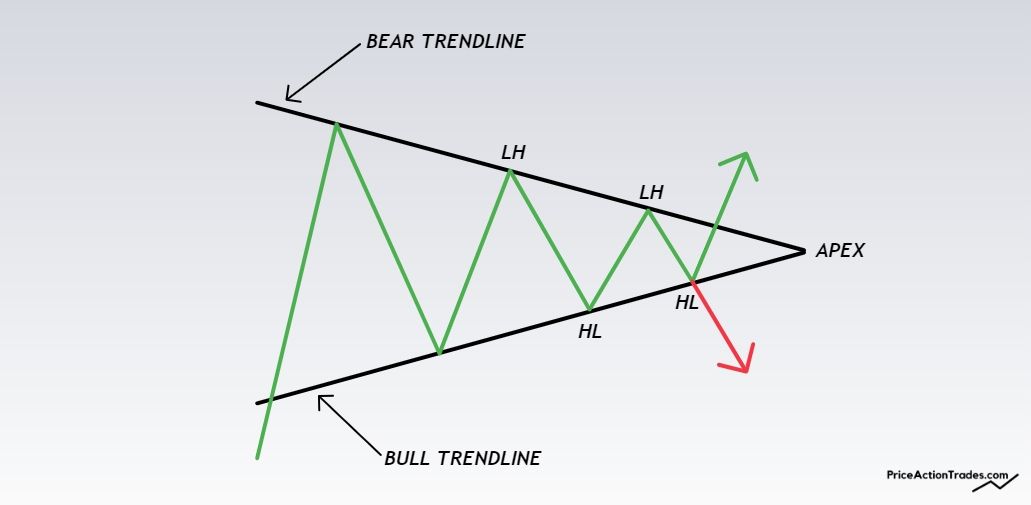
The trendline that connects the Swing Highs slants downward (Bear Trendline).
And the other trendline that connects the Swing Lows slants upward (Bull Trendline).
Together these trendlines meet or converge at a certain point called the “Apex”.
A Symmetrical Triangle should have at least five touches before the breakout appears.
The five touches generally appear 3 in the Upper and 2 in the Lower Trendline or vice-versa.
The next thing is:
The volume behavior.
The volume should start to decrease during the pattern formation and will be at a historical low right before the breakout.
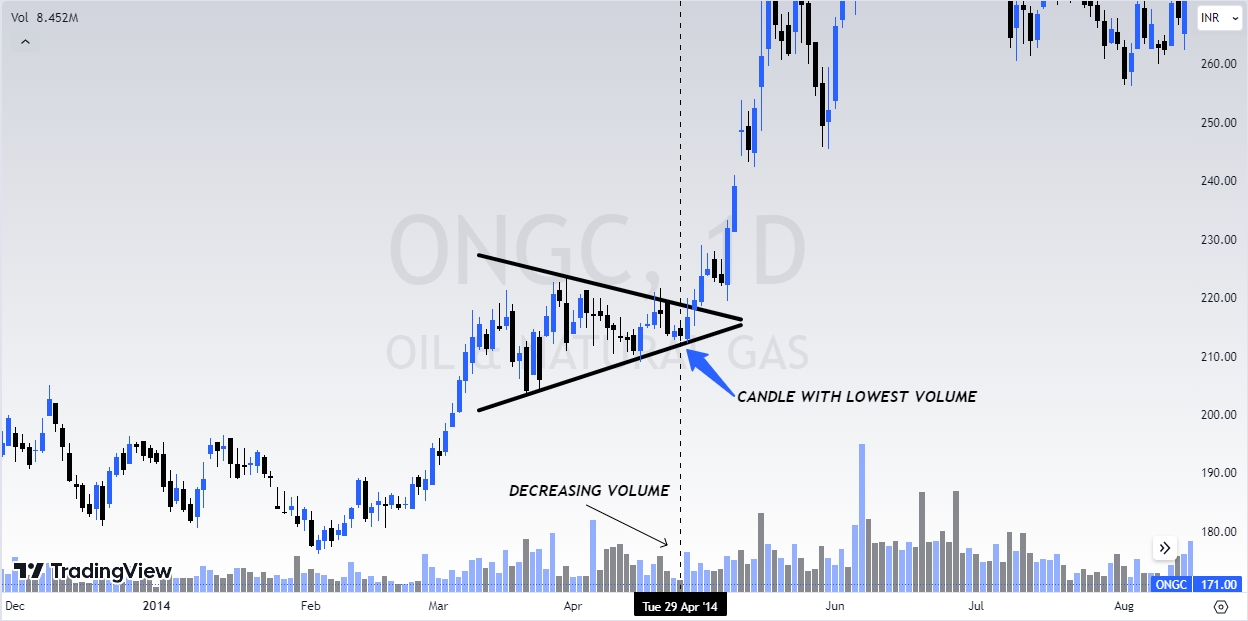
If the volume is not gradually decreasing inside the pattern…
…The breakout may not be as successful or smooth compared to the one with decreasing volume.
I know what you are thinking now:
Why the decreasing volume is a good sign?
Let me explain:
When both price and volume contract, they tend to break out from the pattern with increased Volatility & Momentum.
You are probably thinking:
What causes the price to break out with high momentum?
The decreasing range and volatility of the triangle formation build up tension.
When the breakout is imminent there tends to be a lot of Buy & Sell Stop Orders above and below the Highs & Lows of the triangle.
The moment the breakout appears, all of those pending stop orders get triggered…
…And thereby creates a lot of buying and selling pressure depending on the direction of the breakout.
How to Trade a Symmetrical Triangle?
You can trade a Symmetrical Triangle in three different ways.
And the method or way you follow will depend on your style of trading.
Method #1: Anticipatory
An Anticipatory setup is where you open a position before the breakout.
The moment the price touches one of the trendlines for the third time…
…Open a Buy or Sell position based on your anticipated direction of the upcoming breakout.

If you are thinking the market is likely to break out upward, initiate a long position when the price will touch the lower trendline (upward slanted) for the third time.
But what if you have a bearish bias and want to go short?
Just reverse the process and open a Short Position when the price touches the Upper Trendline (slanted downward) for the third time.
In the following chart of Oil & Natural Gas Corporation, the price action gave a short selling signal when it touched the upper trendline of the Symmetrical Triangle.

And as expected the stock did a downside breakout since the underlying trend was also bearish.
Another method of taking a position is to open a trade when one or two candles close inside the triangle after the third touch.
For the Stop-Loss…
Place it below the Last Swing Low for bullish positions.

If your position is bearish, consider placing it above the Last Swing High.

But do keep in mind that this technique is anticipatory or aggressive because you are Buying or Selling the market without knowing its next directional movement.
Method #2: Trendline Breakout
The next method of trading a Symmetrical Triangle is after the price breaks out from the pattern.
If the price is breaking out through the upper trendline of the triangle, you open a Long Position.
Even better:
If the breakout candle closes above the Upper Trendline, Last High, or both…
…It gives a stronger BUY SIGNAL.
In the following chart of the NIFTY BANK Index (Ticker: BANKNIFTY) the price action gave a buy signal after the breakout candle closed above the Upper Trendline.

But what if the price breaks out through the Lower Trendline?
Well, you should open a short position.
As I already said earlier:
It gives a stronger SELL SIGNAL if the Breakout Candle closes below the Lower Trendline.
Just like in the following chart of ONGC, the price gave a SELL SIGNAL after a candle closed below the Lower Trendline of the triangle.

For the Stop-loss:
Put it either below the Last Swing Low of the Symmetrical Triangle (or above the Last Swing High if you are Selling).

However, if you are a bit aggressive in terms of protecting your capital…
Place it below the Breakout Candle if the position is Bullish or above the Breakout Candle if the position is Bearish.

Method #3: Pullback Entry
This is the most conservative approach to trading a Symmetrical Triangle.
As you may already know:
A pullback is when the price does a return move to the breakout price level or some extent.
You can take a pullback entry in 2 different ways.
I’ll explain:
The first is…
Open a new position when the price returns to the previous Resistance or Support zone.
In the following chart of ONGC…
…The price visited the previous Resistance Zone (marked with a green rectangular box) as Support and continued the uptrend from there.

Even better:
Initiate a new position when the price breaks out again from the range of the Pullback in the underlying trend direction.
Just like this:

I call this a “Continuation Breakout”.
The Stop-Loss placement for this setup is either below (for Longs) or above the Breakout Candle (for Shorts).
Here’s another way:
Put your SL just below the last Swing Low for LONGS or above the Last Swing High for SHORTS.
In the following image, I marked the Last Swing Low with a black arrow mark for a pullback that did the breakout to the upside.

How to Measure the Target of a Symmetrical Triangle?
You can measure the Technical Target of a Symmetrical Triangle in 2 ways.
The first is the most common and widely used.
The second is a bit advanced and not so commonly used.
#1: Height Measurement Technique
Select the Trendline Tool, click on the broadest part of the pattern, and drag the line to the opposite trendline.
Now place the line on the location of the breakout.
Just like this:

#2: Parallel Lines Technique
The Parallel Lines Technique is done by drawing a trendline from the highest peak (anchor point) of the Symmetrical Triangle parallel to the Lower Trendline.
Just like this:

The target achieves when the price touches the Trendline drawn from the highest peak of the pattern.
In the example chart above of TATA MOTORS LTD…
…The price didn’t reverse from there but stalled and faced nearby resistance before the continuation of the uptrend
For downward breakouts:
Draw a line from the Lowest Valley (anchor point) of the pattern parallel to the Upper Trendline of the Triangle.
In the following chart of Infosys Limited (Ticker: INFY)…
…The price started to reverse and changed the trend direction upon touching the Extended Downward Trendline.

And don’t forget to book your profit when the price touches the imaginary line drawn from the Lowest Valley of the pattern.
Triangle Apex and Turning Points
There is a spooky fact when it comes to Symmetrical Triangles.
See this:
When the pattern breaks out to either side…
…The price usually reverses, stalls, or continues at the Bar (or Candlestick) that corresponds with the triangle’s Apex.
In the following chart of ONGC, the stock printed a bearish candle (marked with 1) very close to the Apex of the Triangle.

Here’s another chart from Apollo Hospitals (Ticker: APOLLOHOSP)…

…There was no immediate direction change but the price underwent resistance and formed a pivot point there (price peak).
Afterward, the stock gradually started to change its direction.
This might sound impractical but it happens from time to time.
You can use this to your advantage when in doubt.
It will help you to take profits, cut your losses, or to add to your winning position if a specific financial instrument does a continuation from there.
Found this article helpful?
How do you trade Symmetrical Triangles?
Do let us know in the comments section below.