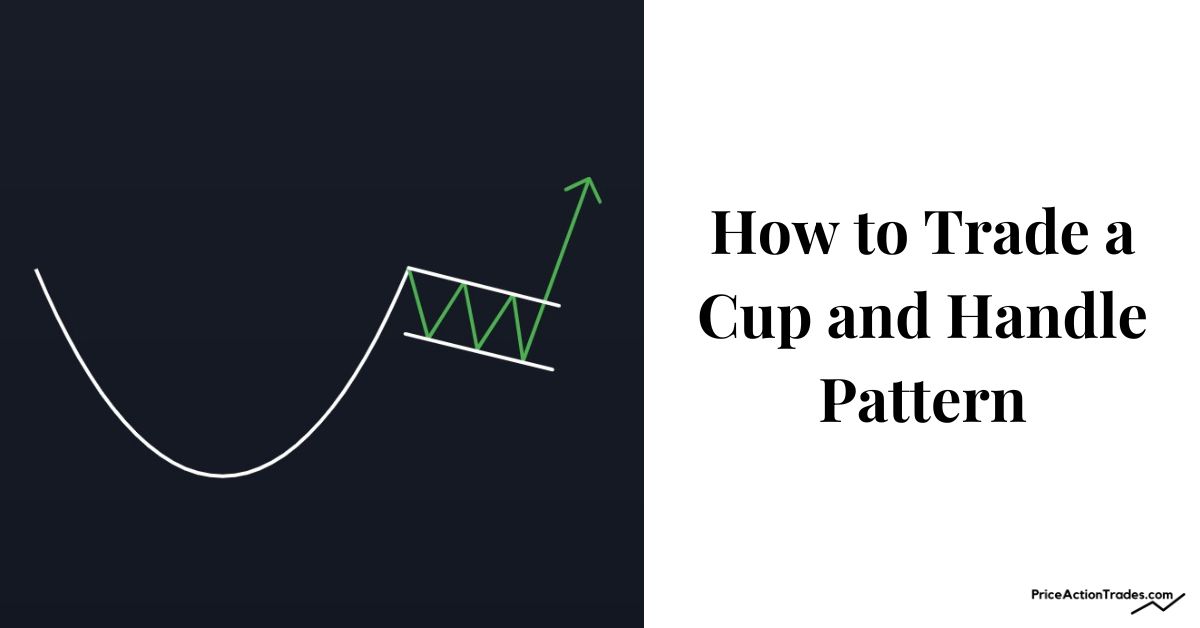
This article teaches you how to trade a Cup and Handle as a Reversal and Continuation pattern.
The pattern is super common, especially in stock markets.
The best part?
The pattern is easy to trade.
In this easy-to-follow guide, I’ll walk you through every step to trade this pattern like a pro.
Let’s dive right in.
What is a Cup and Handle Chart Pattern?
A Cup and Handle is both a bullish continuation and a reversal chart pattern that generally appears in an uptrend.
The pattern has a rounded shape and looks like a Saucer or a Half-Drawn Circle.
The Handle of the pattern is nothing but a pre-breakout build-up or retracement.
And together with the rounded shape the pattern looks like a Cup with a Handle (the way your teacup looks).
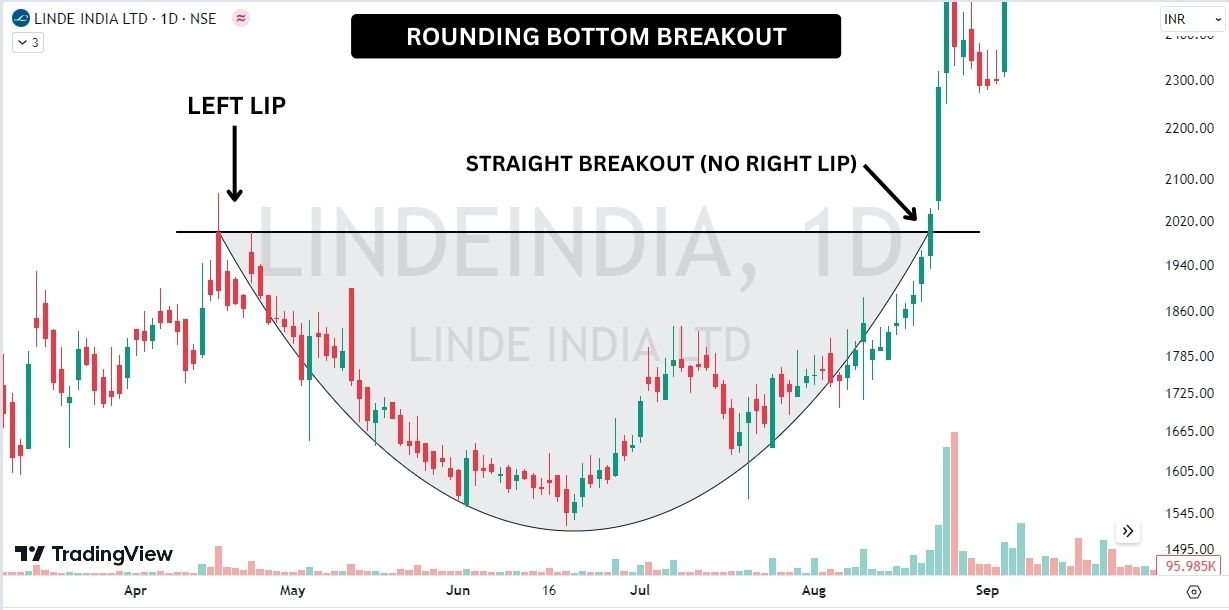
However, when this pattern forms without a handle…
…The pattern is simply called a Rounding Bottom (aka Saucer Bottom).
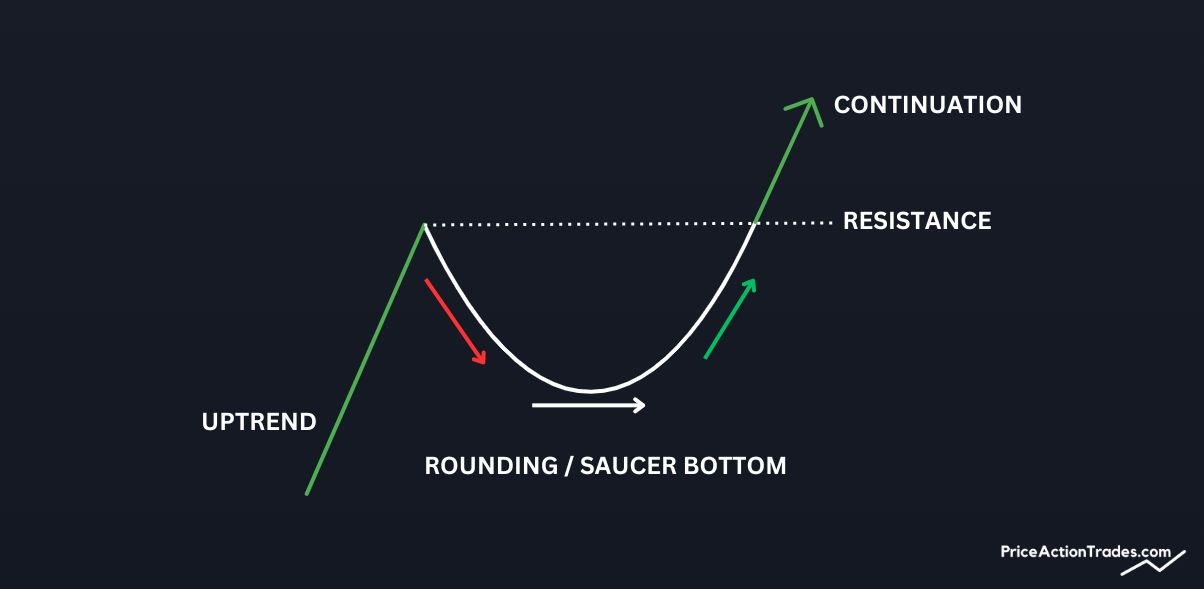
So when the Handle is absent it often indicates that the price is rising with great enthusiasm without much resistance reaction.
How to Identify a Cup and Handle Pattern?
A Cup and Handle Chart Pattern consists of five basic components.
- Left Cup Lip
- Right Cup Lip
- Flat Base
- Handle
- Saucer Shaped Volume
All you need to do is to find the pattern with these components.
I’ll explain:
The price starts to fall slowly from a peak for several days (or bars) and takes on a curved shape.
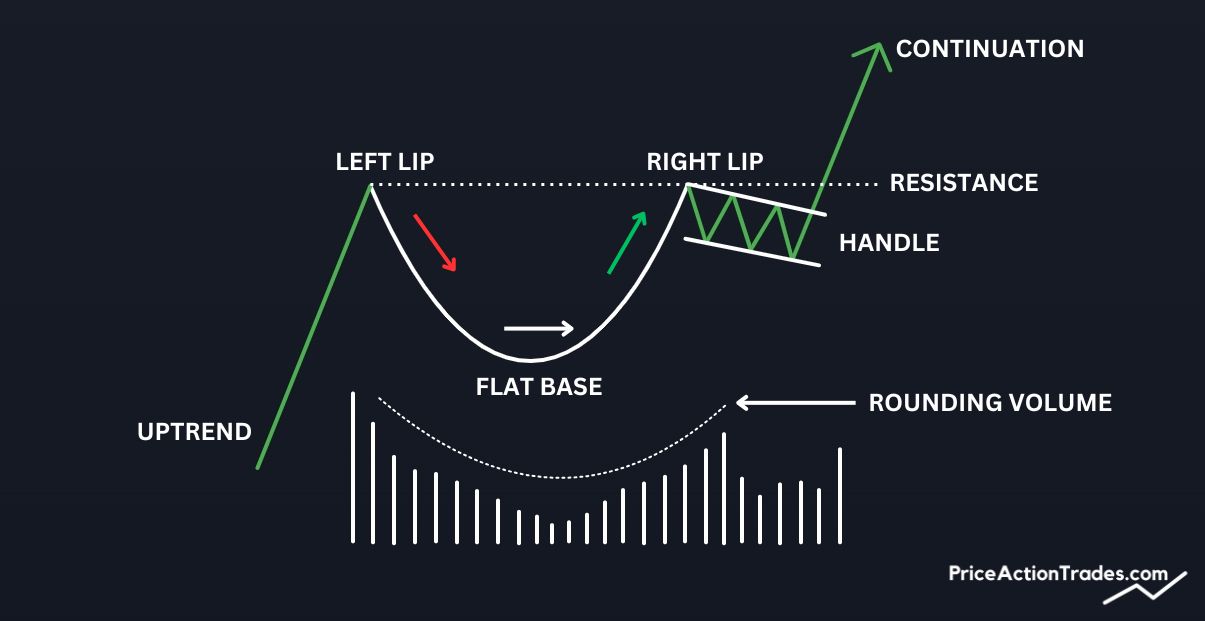
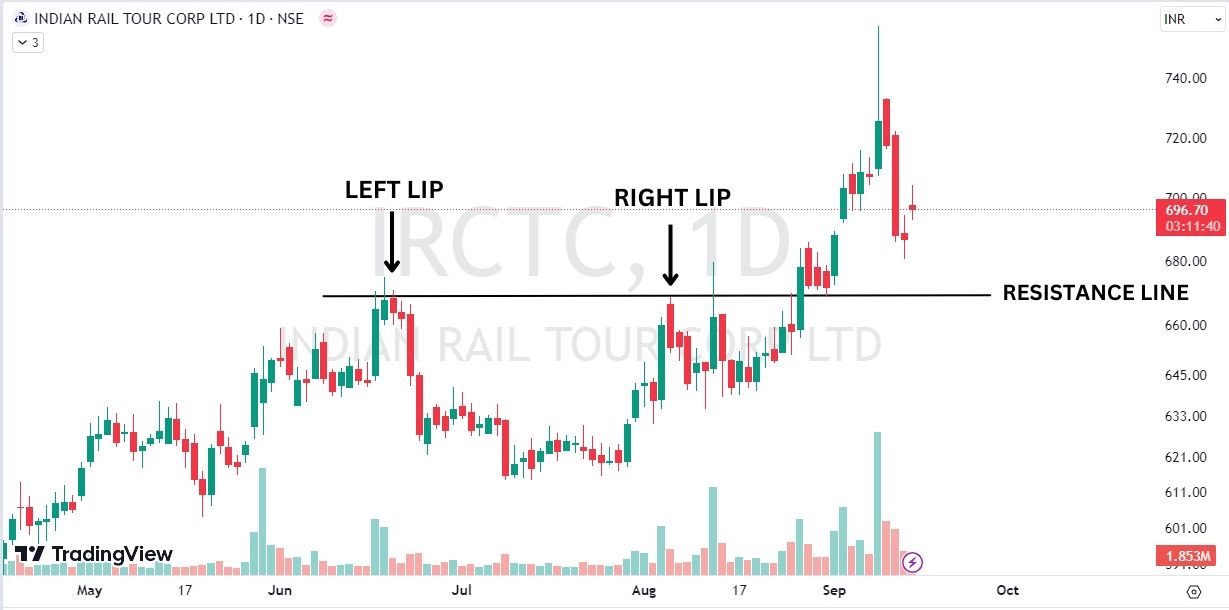
The peak from which the price starts to fall is called the “Left Lip” of the Cup.
Following this, the price stops falling further and starts to build a range for another several bars.
This range is the “Base” of the Cup.
The Base is nothing but a strong support level of the pattern.
Following the Base, the price starts to move slowly upward with a curved shape and increasing volume.
Now, often the price stops rising higher at the Resistance of the Left Cup Lip.
The price often moves in the opposite direction before it continues rising higher.
The price level or the peak from which the price does the downside retracement becomes the Right Cup Lip.
And the Handle?
Well, the Handle is the retracement itself and its shape varies in each formation (they could be like Troughs, Rectangles, or Tilted Congested Zones).
But you should pay attention to the volume.
The volume of a Cup and Handle Chart Pattern also often takes the form of a Saucer.
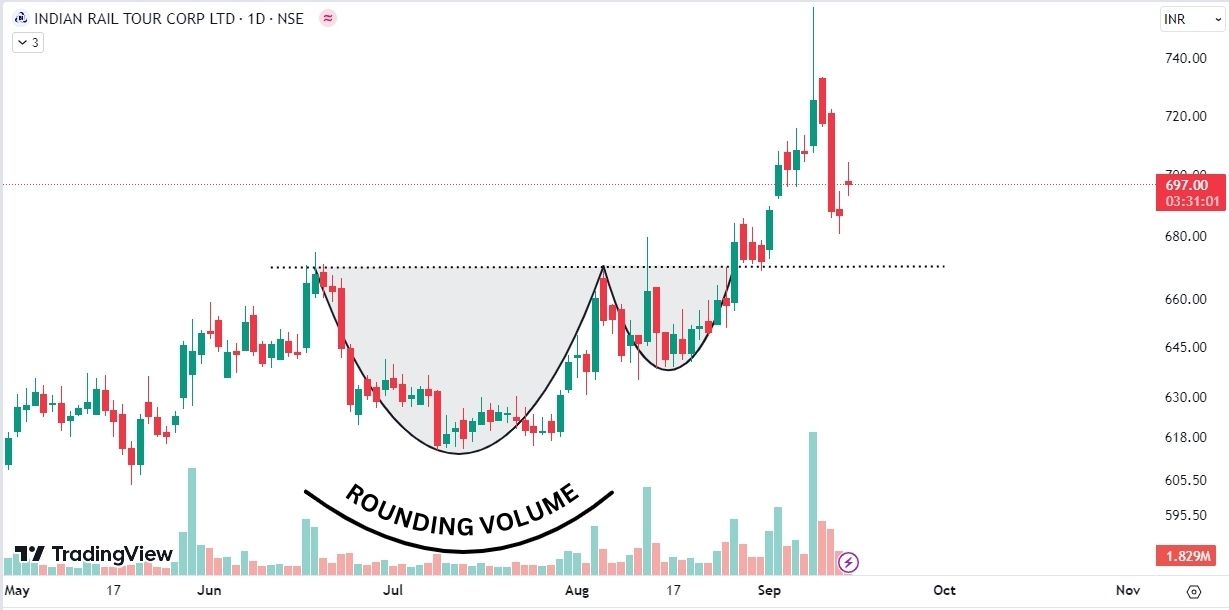
Because volume tends to be high while the price falls from the Left Lip but gradually decreases as it reaches the base of the Cup.
And again the volume gradually increases as the price starts to move up.
This volume behavior is not necessary although it happens often.
A Cup and Handle Pattern usually works best in an Uptrend.
How to Trade a Cup and Handle Chart Pattern?
To trade a Cup and Handle Chart Pattern, you just need to follow 3 simple steps.
The first is:
Opening your position.
The second is:
Closing or exiting a position or placing your Stop-Loss.
The third is:
The calculation of your price target.
Let me explain:
How to Draw a Cup and Handle Pattern Before Opening a Position?
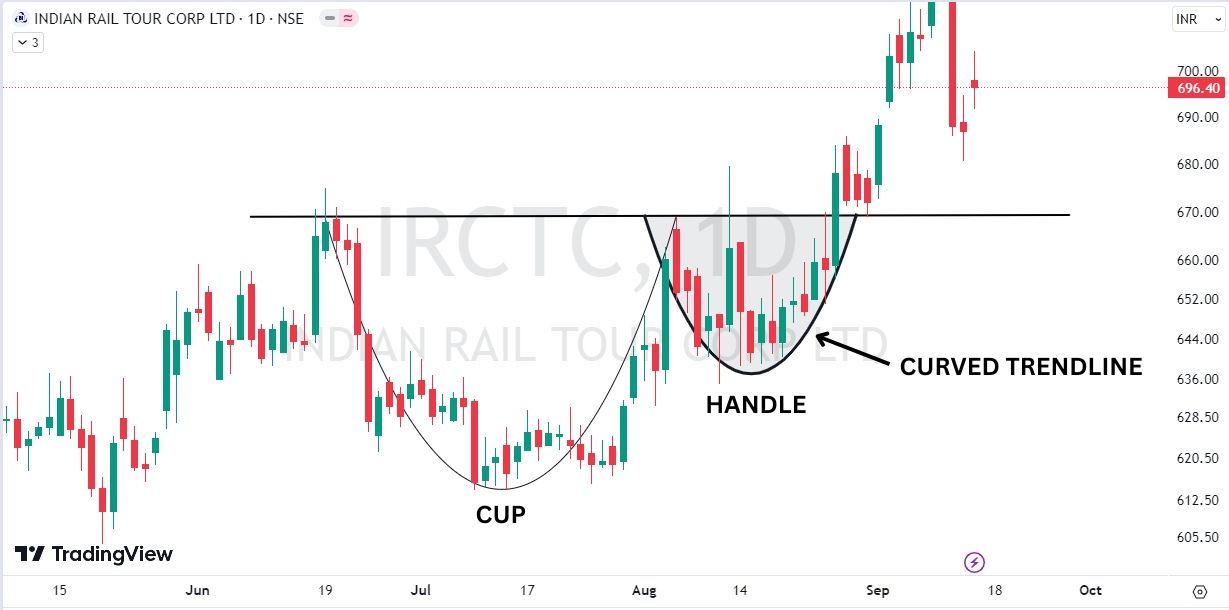
Draw a trendline by connecting the Highs of the Left and Right Cup Lip.
But if it is a Rounding Bottom without a Handle formation…
…Then only mark the Swing High of the Left Cup Lip with a trendline.
You can also draw curved trendlines to connect the lows of the Rounding Bottom formation (or Cup formation).
It’ll make the pattern more pronounced.
If the Handle is U-shaped…
…Again you can draw curved lines along the Lows of the Handle.
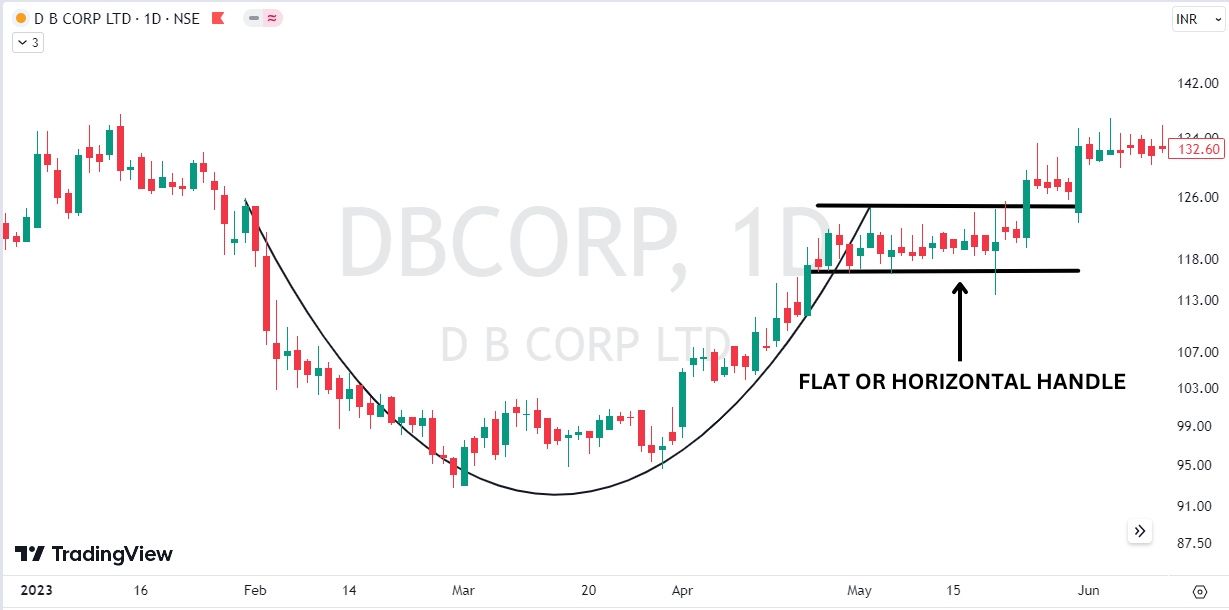
But in case the Handle is Flat or Tilted consider marking its Highs and Lows using conventional trendlines.
Just like this:
Trading Method #1: Breakout Entry
This is super simple:
The moment the price breaks out through the Resistance Line and closes above it…
…Open a long position on the next candle open.
PRO TIP: If you are trading on a higher time frame then you can open a position if a 5 or 15-Minute candle closes above the Resistance Line of the Cup.
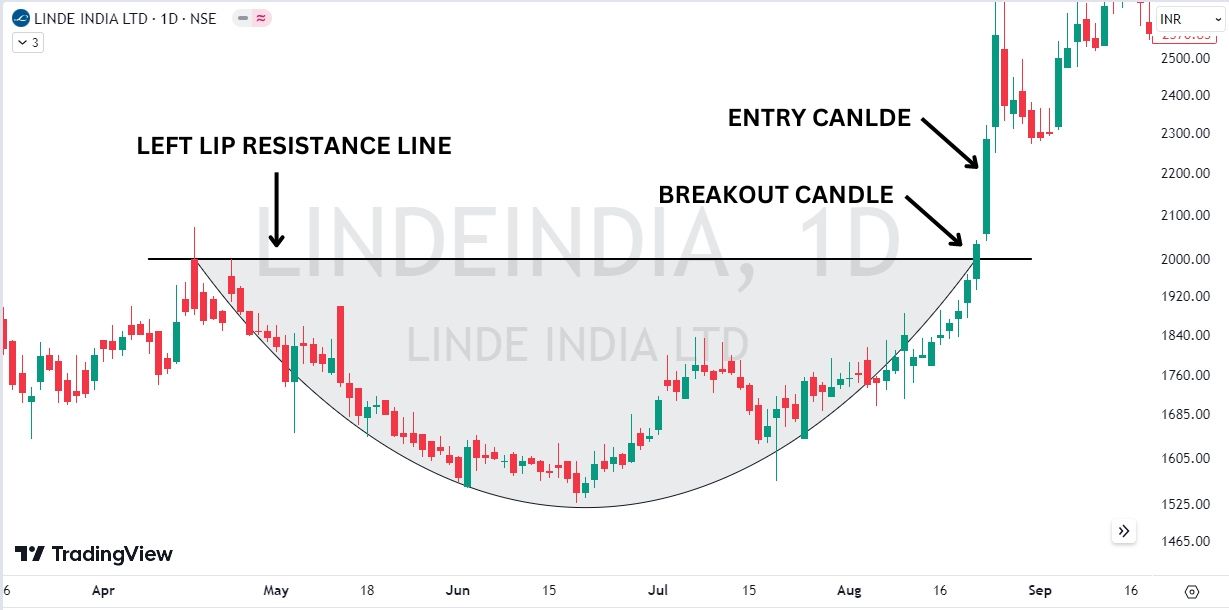
Want a breakout entry example for a Rounding Bottom?
See the following:
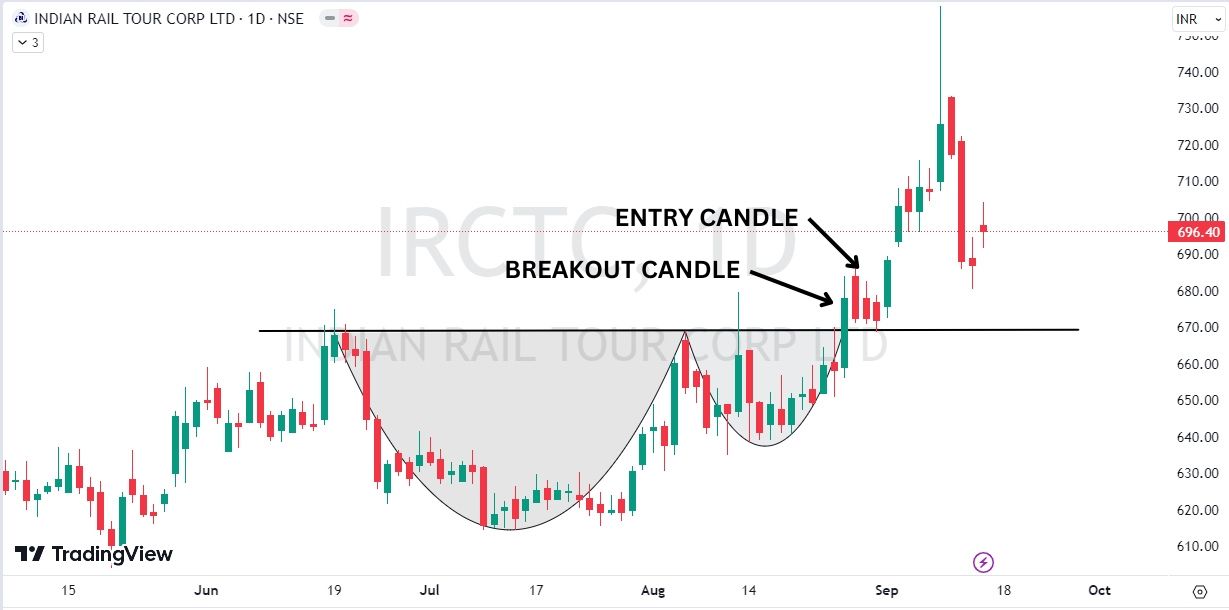
But you know what happens sometimes?
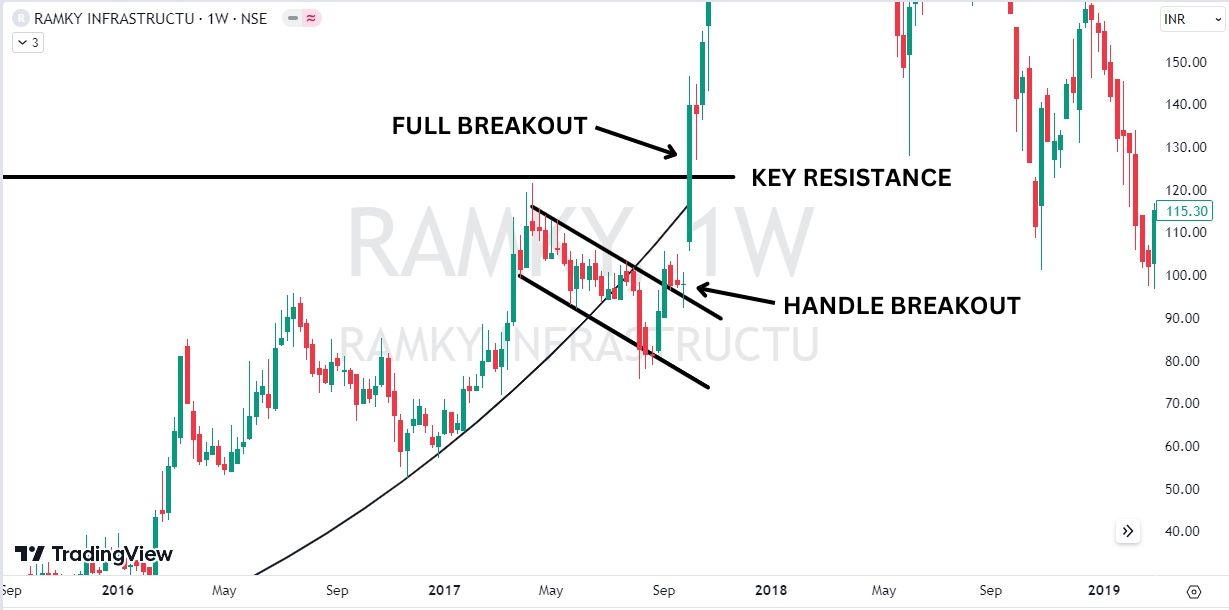
The price breaks out through the Resistance Line of the Handle but doesn’t close above the Key Resistance of the Saucer Formation.
Like this:
In such scenarios, you can open a small Long position and increase the size if the price closes above the Key Resistance Line.
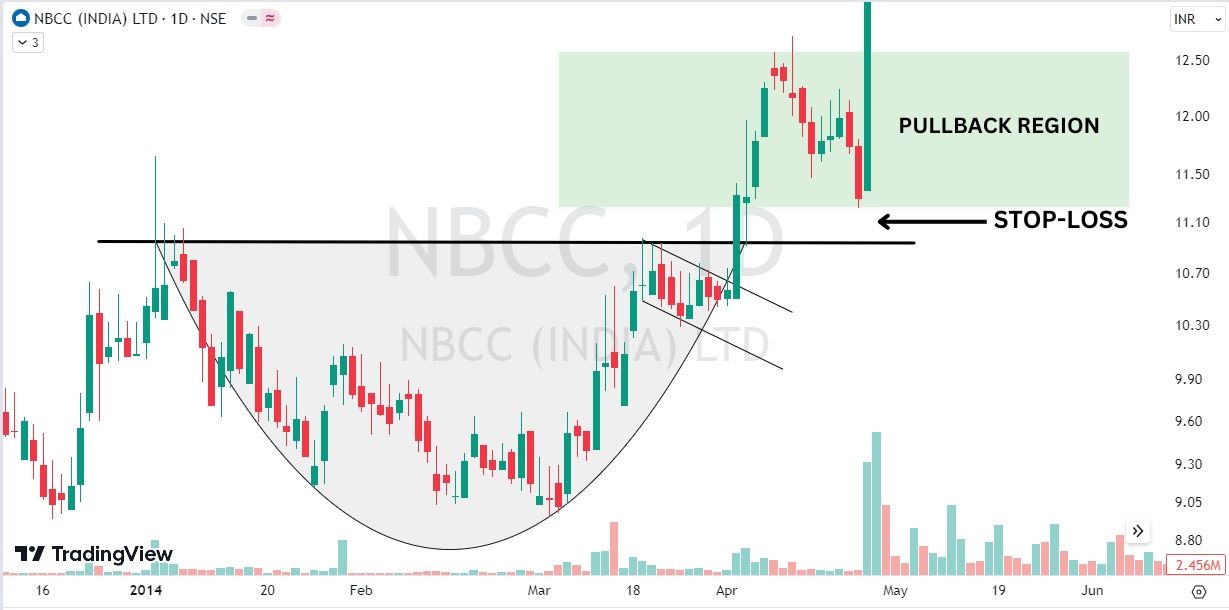
Trading Method #2: Pullback Entry
A Pullback trade gives you more confirmation.
This is because the price comes back to the breakout price level to retest the strength of the new Support Level (Cup resistance turns support).
And if enough buyers are on the support level the price continues to climb higher.
You’re probably wondering:
How would I trade such a Pullback?
Well, you can trade the pullback in 2 different ways.
The first way:
Buy the stock at the moment when a candle or two close above the new Support level.
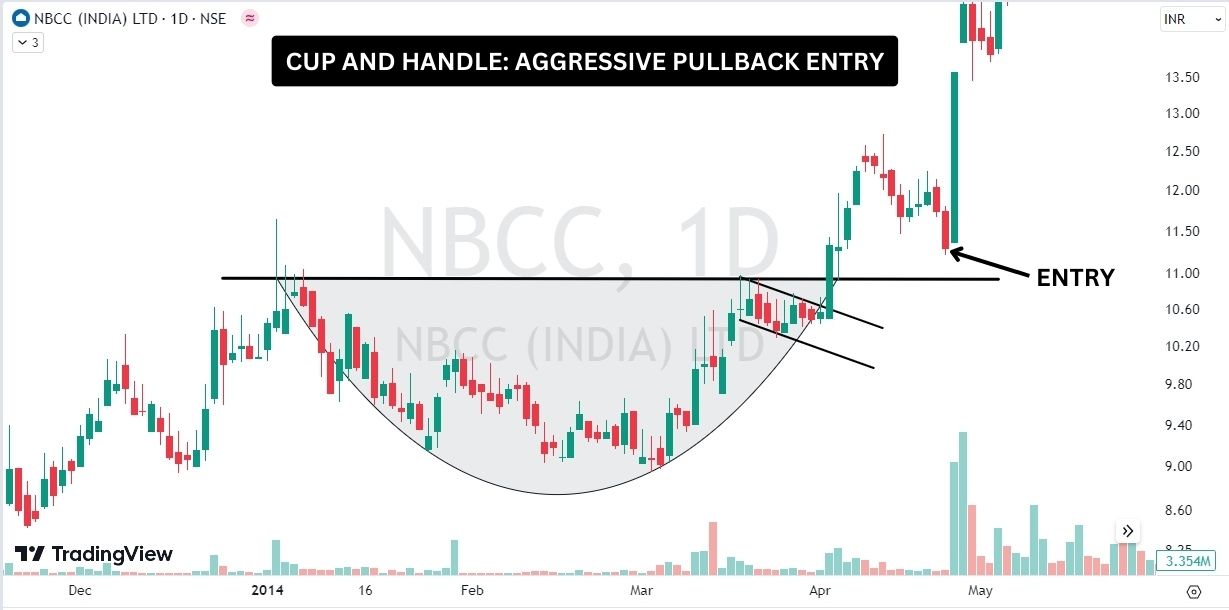
The second way:
Buy the stock when the price closes above the high or resistance level of the Pullback.
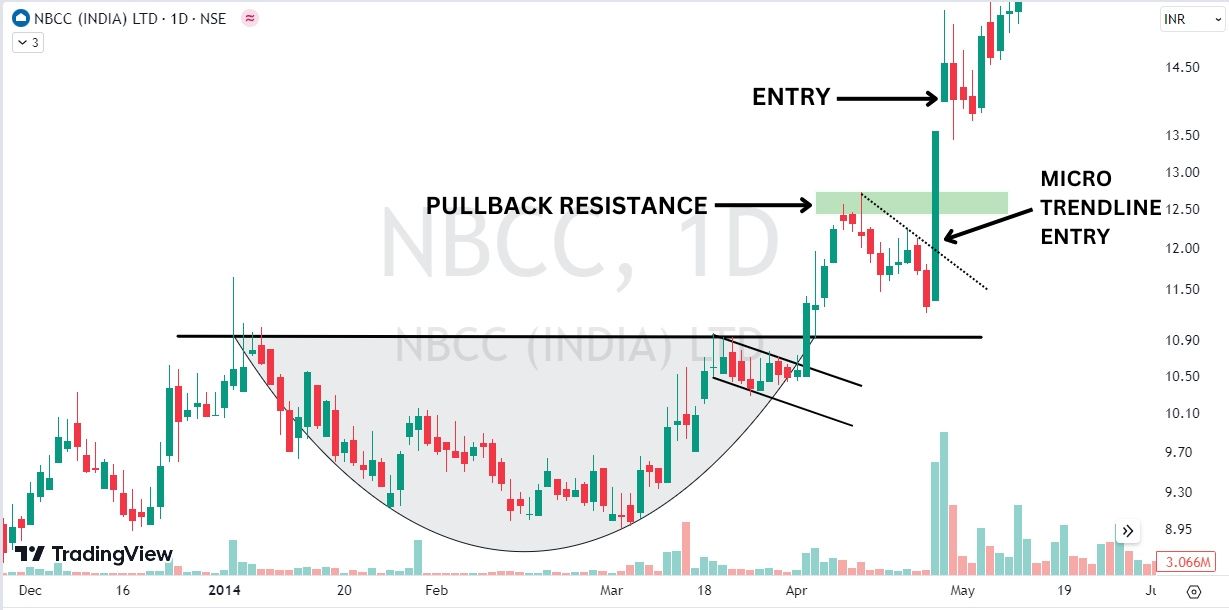
This Pullback Entry technique provides a more confirmed trade entry, hence it gives you more confidence as well.
So if you are a conservative trader…
…Go with the Pullback Entry technique (especially the Second Way).
How to Place Stop-Loss in a Cup and Handle Pattern?
There are two ways to place your stop-loss.
The first is:
Put your SL a point below the Low of the Breakout Candle.
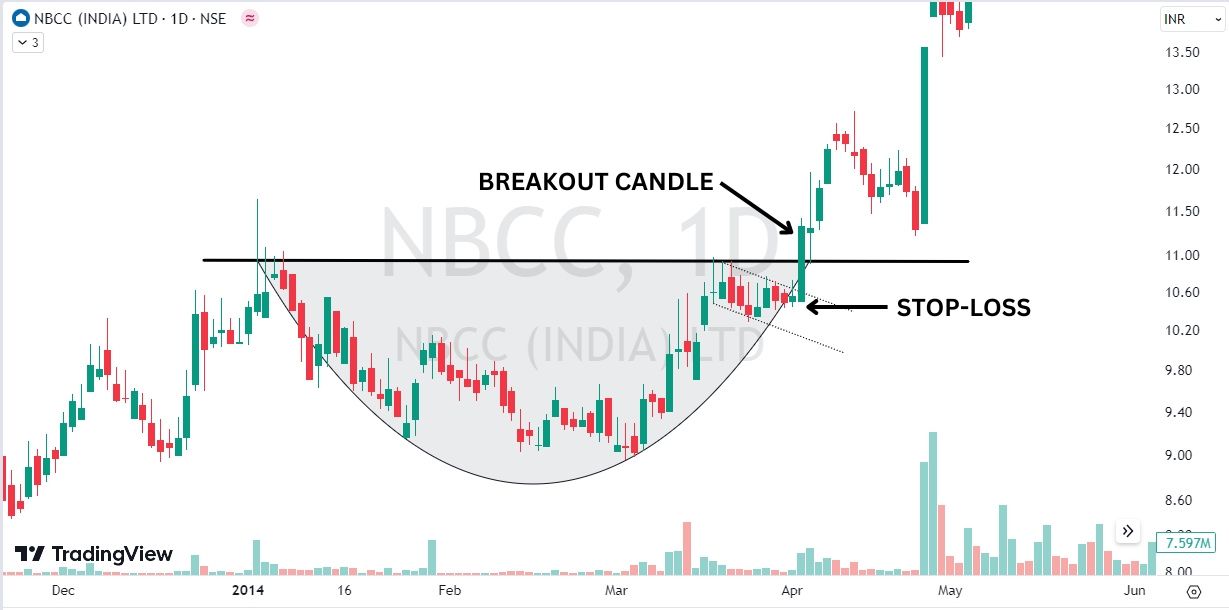
The second is:
Put it a point below the Low of the Handle.
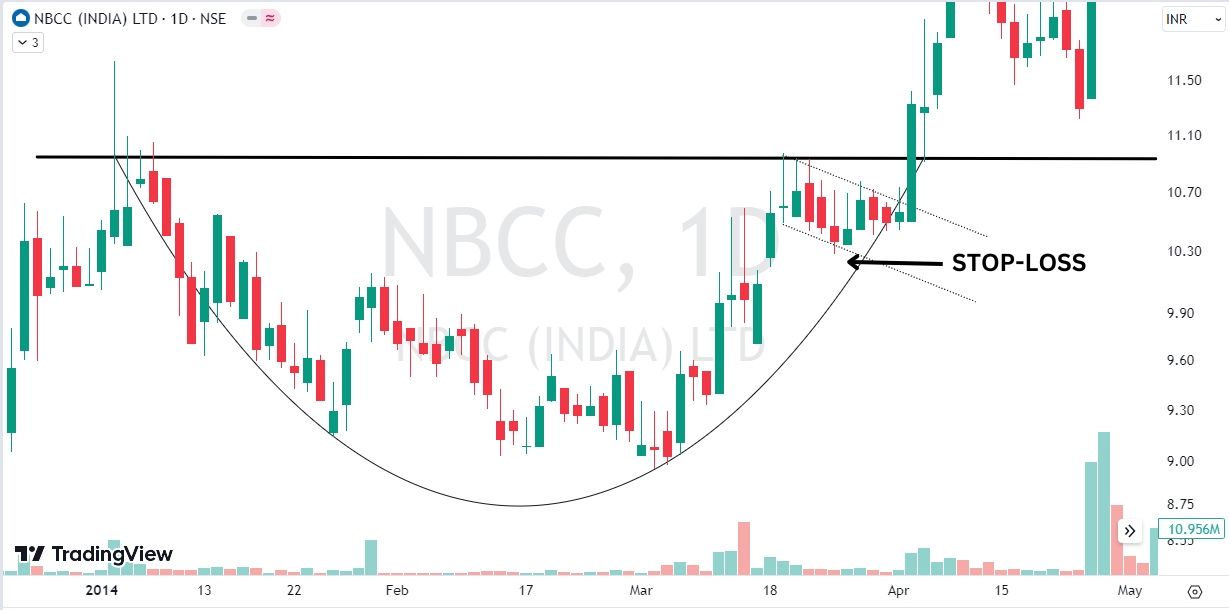
But if you are trading a Pullback, put it below the Low of the Pullback region.
The second technique is the most suitable and recommended place to put your SL.
The reason is:
When you put Stop-Loss below the Handle or Pullback Low…
…It reduces the chances of triggering the SL unnecessarily.
How to Measure the Target of a Cup and Handle Pattern?
You can use four different methods to measure or calculate the target of a Cup and Handle Pattern.
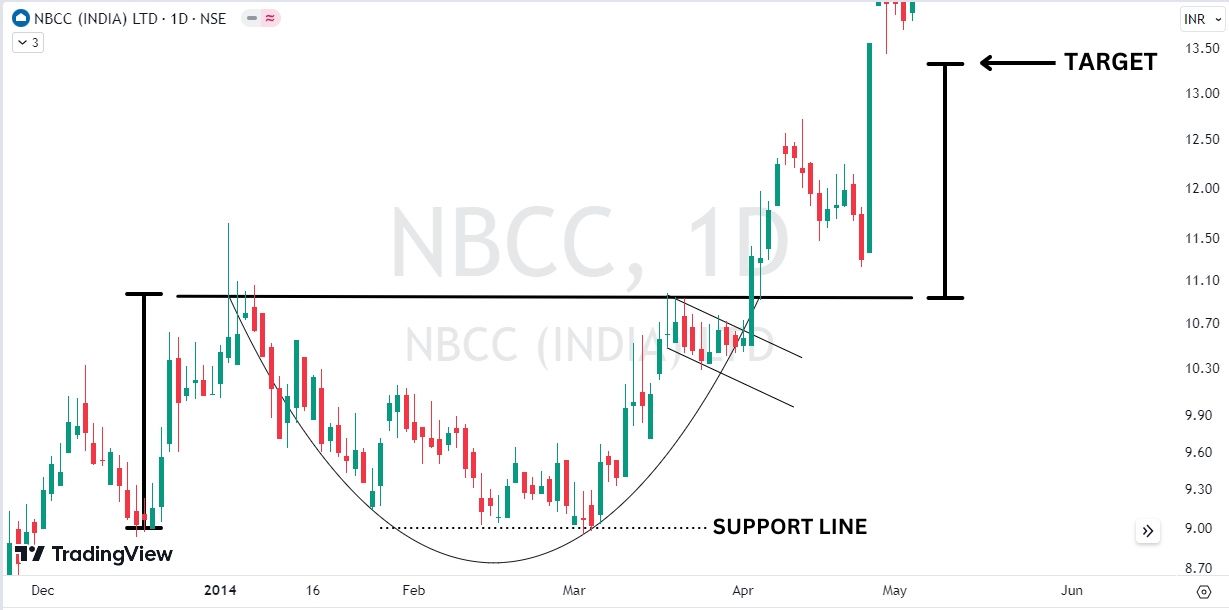
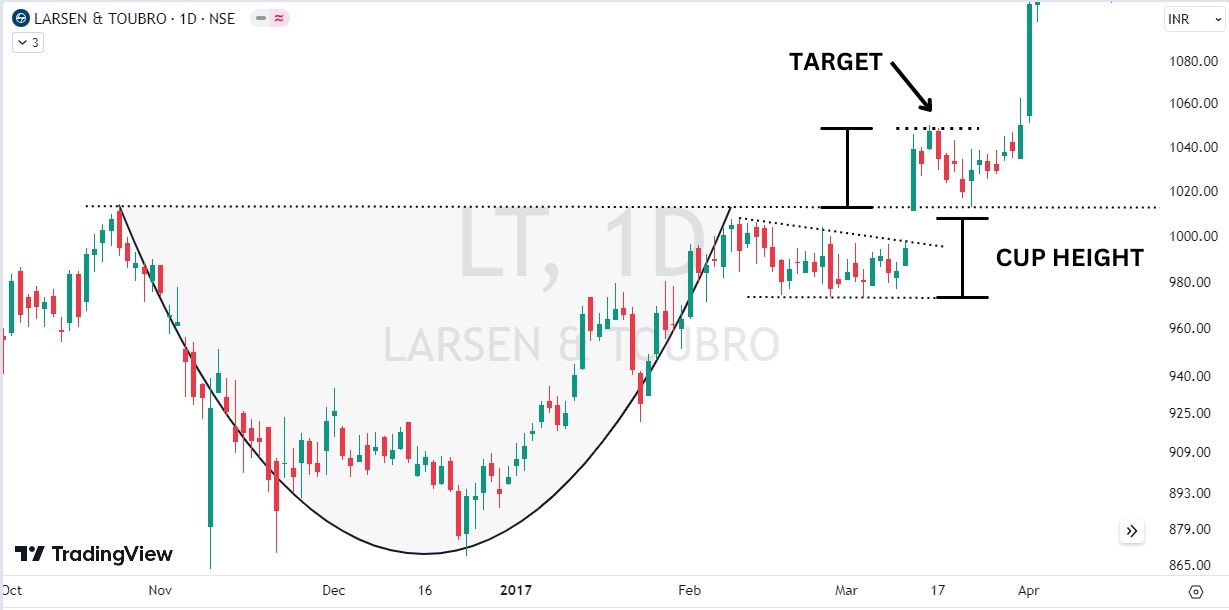
#1: Height of the Pattern or Cup
Calculate the distance between the Resistance and the Base (Support) of the Cup using the trendline tool.
Now add that number to the Resistance Line of the Cup and you’ll get your potential price target.
Just like this:
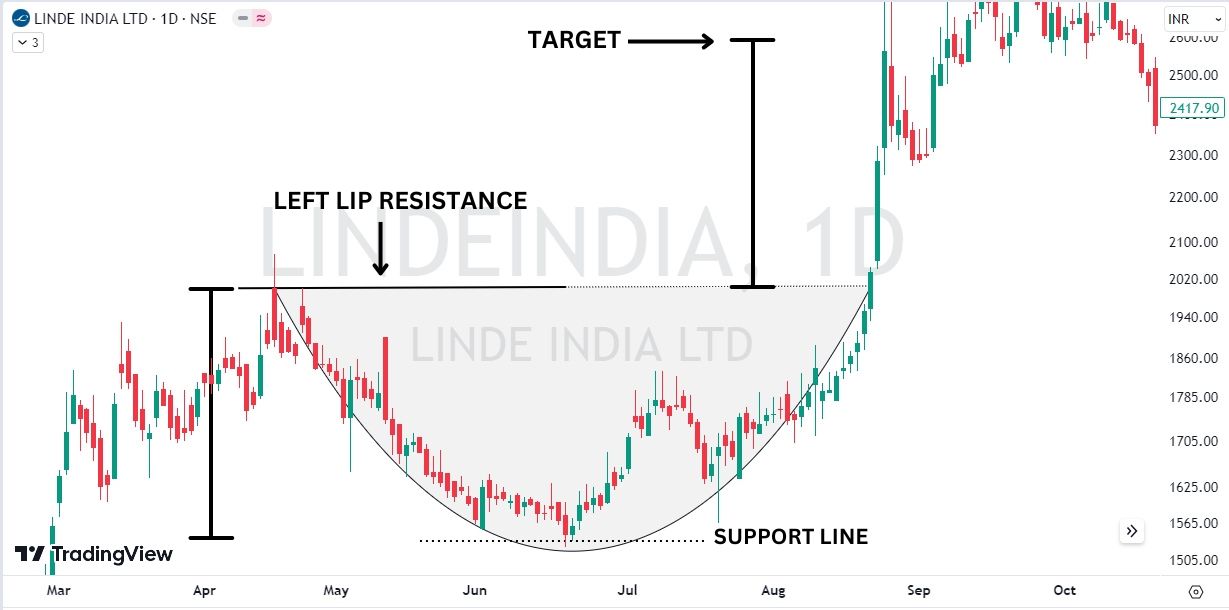
But what if the pattern is simply just a Rounding Bottom?
I mean when there isn’t a Handle.
Then do this instead:
Measure the distance between the Left Cup Lip and the Base of the pattern.
And add that distance to the Swing High of the Left Cup Lip.
But there’s a caveat:
If the height of the pattern seems too long…
…Then consider taking only 50% height of the Cup.
This will help you to reach the target more easily.
You’re probably wondering:
What’s wrong with the full height of a very tall pattern?
Because, in such cases, the stock (or whatever financial instrument) might struggle to reach there.
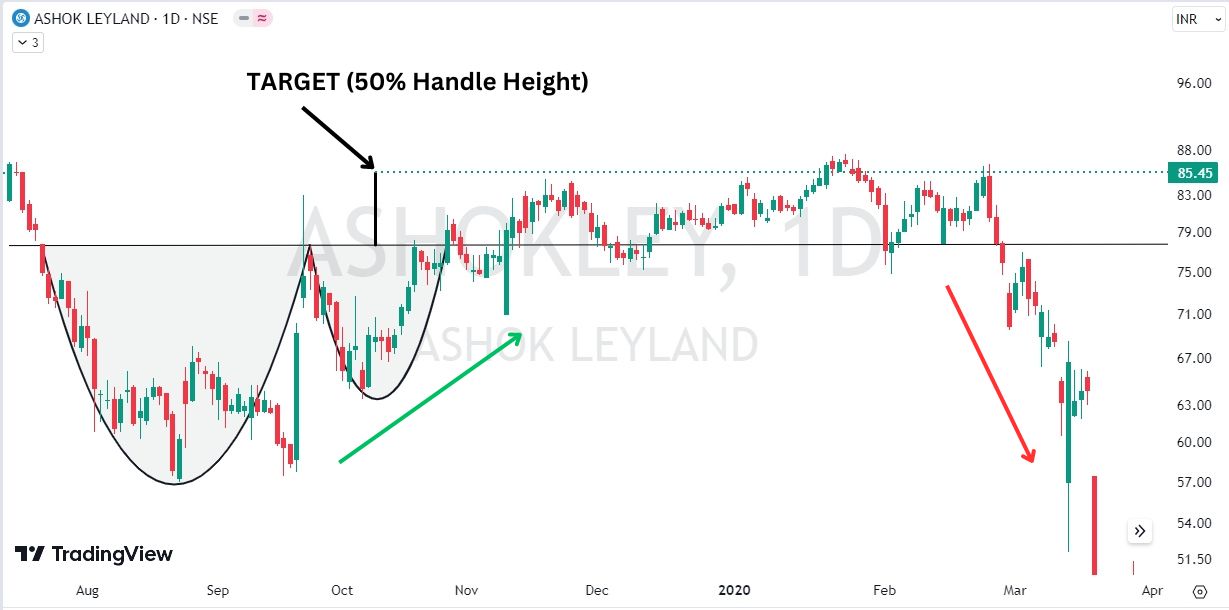
#2: Height of the Handle
The Handle height method comes in handy even when the half-height of the Saucer Bottom becomes hard to achieve.
As the name suggests, here you take the height of the Handle (Handle High to Handle Low) and add it to the breakout price level.
But there’s a catch:
Even when the height of the Handle also seems too high to achieve…
…Then you can consider taking only 50% of the Handle height and adding it to the breakout point.
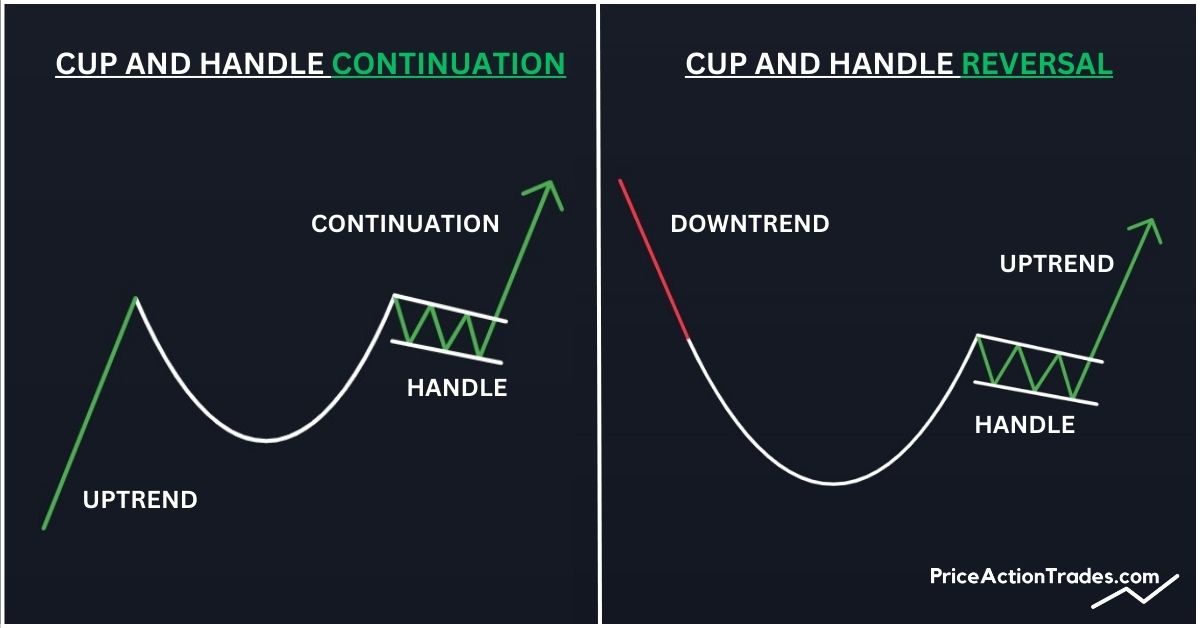
Cup and Handle Pattern: Reversal vs. Continuation
This is very important:
Ensure the Cup and Handle you are trading is a Trend Continuation or Reversal Pattern.
Because the location at which the pattern forms might impact the outcome of the trade.
Let me explain:
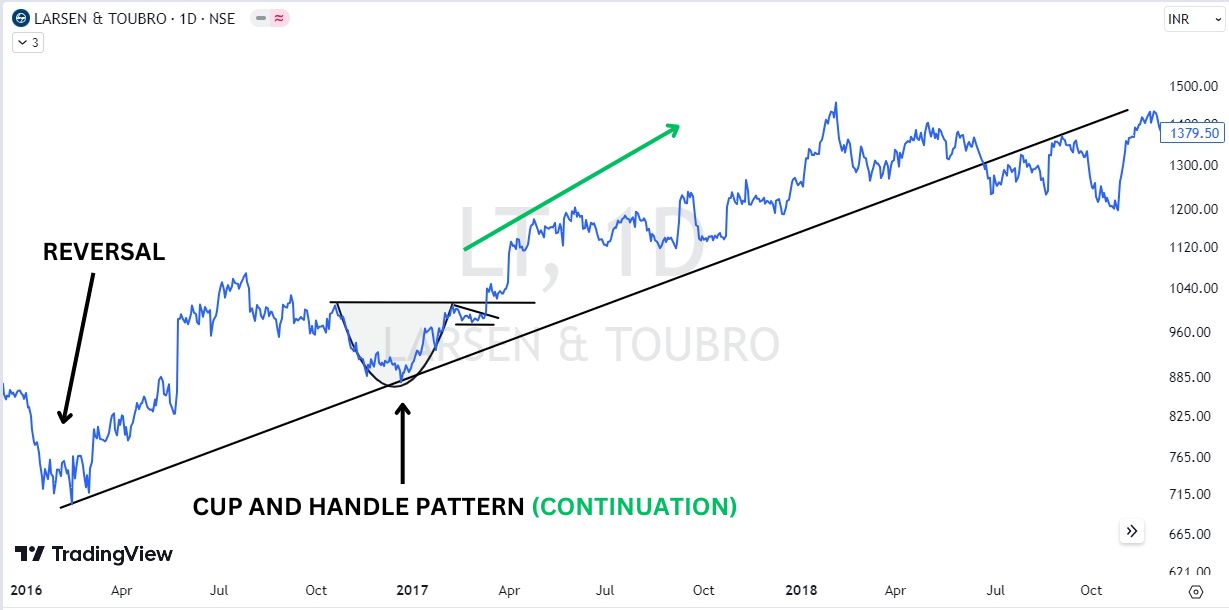
A Cup and Handle Pattern performs best when it forms a continuation pattern of the underlying uptrend.
But what if this pattern forms in a Downtrend?
Then you need to be a bit careful.
The reason is:
When this pattern breaks out to the upside in a Downtrend…
…It may not rise as high as it does in an Uptrend.
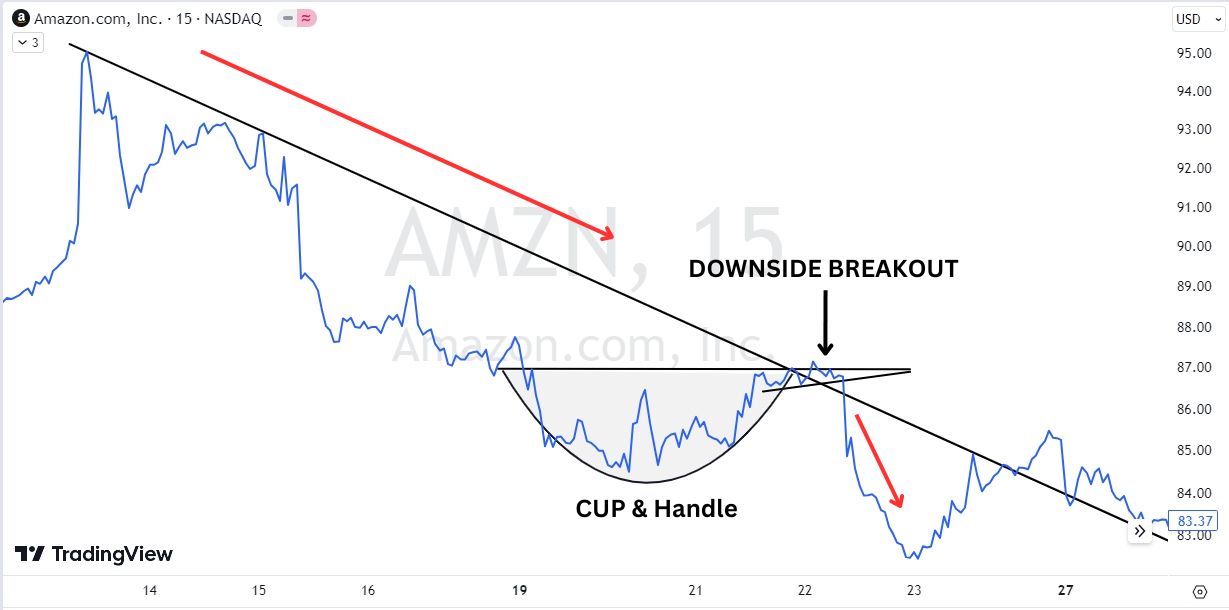
This is because when the market’s primary trend is Bearish, the Sellers usually have more power over the Buyers.
Hence they might prevent the price from climbing exceptionally higher.
So when you’re in doubt:
You can apply the Handle Height Technique to your target.
However, since nothing is guaranteed in trading…
…A Cup and Handle may even end up forming a Bullish Reversal pattern at the end of a downturn.
In such scenarios, the stock you’re buying may rise much higher than the technical target.
How do you trade a Cup and Handle Pattern?
Do share your tips, thoughts, and experiences in the comment section below.
Frequently Asked Questions:
A Cup and Handle Pattern is generally a Bullish Chart pattern when it appears in an uptrend.
The success rate of the Cup and Handle Pattern is about 60%. This success rate is based on the probability of hitting the price target.
A Cup and Handle can be bearish if the pattern appears in a downtrend.
The Opposite of a Cup and Handle Pattern is the “Inverted Cup and Handle Pattern”. The pattern is called “Inverted” since it is the upside-down version of the regular Cup and Handle Pattern.
A Cup and Handle works fairly well, especially Bull Markets.
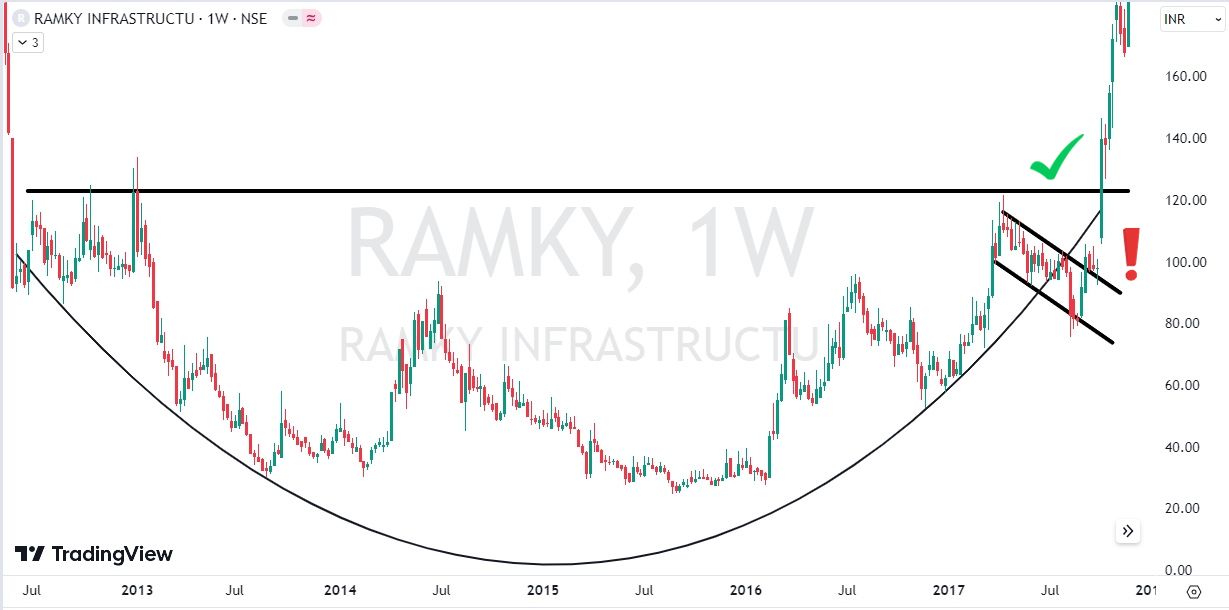
A Cup and Handle gets invalidated in 2 conditions:
#1. If the Handle of the pattern retraces more than 1/3rd of the height of the Cup. But I personally consider 70% of the Cup height.
#2. If the Handle or the price closes below the Swing Low of the Cup (100% invalidation.)
A Cup and Handle can be of any depth. There is a very negligible difference between Deep and Short Cup and Handle Patterns in terms of performance. FYI, short patterns perform slightly better than tall or deep ones.
A Cup and Handle can be tilted both downward and upward. Do remember that if this pattern tilts downward it performs better than the ones tilt upward.